Black Friday Statistics 2026: Quick Insights
Black Friday Online Spend (U.S.): a record $11.8B in 2025 - up 9.1% over 2024's $10.8B
Cyber Monday Online Spend: a record $14.25B in 2025 - the biggest U.S. online shopping day ever
Cyber Week Total: $44.2B online from Thanksgiving through Cyber Monday 2025, up 7.7% YoY
Full Holiday Season: a record $257.8B in U.S. online spend, with mobile driving 56.1% of online revenue
Shopify Black Friday-Cyber Monday Sales: a record $14.6B across the 2025 weekend - up 27% YoY, with 81+ million customers buying from Shopify-powered brands
Shopify Cart Stats: peak processing of $5.1M per minute (12:01pm EST on Black Friday) and an average cart value of $114.70
Buy Now, Pay Later: $1.03B in BNPL spending on Cyber Monday 2025 - the first time BNPL crossed $1B in a single day - plus $747.5M on Black Friday, with over 80% of BNPL purchases made on mobile
Top Category: consumer electronics led Black Friday 2024 with 49% of all items sold; electronics, fashion, and home goods led again in 2025
Early Bird Shopping: over half of shoppers start buying a full week before Black Friday; 33% start as early as 5 a.m.
Top Demographic: middle-aged consumers led at 33% of all Black Friday 2024 shoppers; Millennials were the smallest group at 24%
Black Friday is now a mobile-first, week-long event - and the brands that pre-launch designs, optimize for thumbs, and offer BNPL win the cart. Plan your POD drops early and turn one weekend into a full quarter of revenue. Build your POD brand with Podbase
Black Friday is the time of year when shoppers anticipate heavy discounts on products and wait to fill their carts.
Understanding key Black Friday statistics gives you a clearer picture of how shoppers behave and helps you plan ahead to drive bigger sales.
For print-on-demand brands, understanding these numbers helps plan better product drops, pricing, and promotions. Knowing which categories are trending, how customers spend, and which designs receive the most attention can make a big difference.
If you're gearing up for Black Friday 2026 (November 27), here are some eye-opening statistics to help you plan better.
What is Black Friday?
Black Friday is the biggest shopping day of the year, typically held the day after Thanksgiving in the United States. It's known for massive discounts and a surge in both online and in-store spending.
The name "Black Friday" originated in the 1960s. Retailers used it to describe the day their profits shifted from "in the red" (losing profits) to "in the black" (gaining profits).
The event has grown worldwide, with stores and online shopping platforms offering early deals and weekend-long promotions. Every year, online sales break Black Friday records - 2025 did exactly that, and 2026 is expected to set new highs.
Cyber Monday is another shopping event tied to Black Friday. It is the first Monday after Black Friday, and it offers significant discounts. It started as a way for ecommerce stores to compete with in-store Black Friday sales.
Now, let's dive into some notable Black Friday statistics.
Also Read:
Top Small Business Statistics You Should Know
Top Consumer Electronics Statistics You Must Know
1. How Much Money Is Spent on Black Friday?
U.S. consumers spent a record $11.8 billion online on Black Friday 2025 - up 9.1% from the $10.8 billion spent in 2024, which itself was a 10.2% jump over 2023. The growth hasn't slowed for three straight years.
.avif)
Cyber Monday 2025 was even bigger: it drove a record $14.25 billion in online spend, up 7.1% year over year - the most ever spent online in the U.S. in a single day. Across the full Cyber Week (Thanksgiving through Cyber Monday), shoppers spent $44.2 billion online, up 7.7%.
Notably, this was the second holiday season in a row where Black Friday's growth outpaced Cyber Monday's - shoppers are rewarding early, competitive deals rather than waiting for Monday. The full 2025 holiday season reached a record $257.8 billion in U.S. online spend.
These numbers show how big Black Friday has become. Every year, more shoppers join in to grab the best deals - and for sellers, the lesson sits in that growth pattern: the revenue is moving earlier in the week.
2. Mobile Shopping Takes the Lead
Mobile devices drove 56.1% of all U.S. online revenue during the 2025 holiday season - and the skew is even stronger where it counts: over 80% of Buy Now, Pay Later purchases during the 2025 season happened on smartphones.
.avif)
These Black Friday statistics show how important it is for businesses to make their online stores mobile-friendly. When shopping on phones is fast and easy, people are more likely to buy right away rather than abandoning their cart.
For POD sellers, this stat is bigger than checkout design. Across Podbase stores, about 99% of traffic comes from social channels - TikTok, Instagram, Pinterest - which are mobile-native by definition. Your Black Friday buyer almost certainly discovers the product, evaluates it, and pays for it on the same phone. Every step of your funnel - the video, the product page, the checkout - should be built thumb-first.
3. How Many People Shopped Online During Black Friday?
Black Friday had the highest activity of the 2024 shopping weekend: 87.3 million people shopped online while 81.7 million visited stores - just a 5.6 million difference between the two.
.avif)
By Saturday, shopper behavior started to shift. More people visited physical stores, reaching 61.1 million, while 53.9 million shopped online.
These Black Friday statistics show that even though more people are shopping online, in-store shopping is still popular. Many shoppers enjoy seeing products in person before buying, while others prefer the comfort and speed of online shopping.
For an online-only POD brand, the takeaway isn't to open a store - it's that delivery speed is your answer to "I could just buy it in person." Podbase orders ship in about 23 hours on average, which keeps the made-to-order model competitive with the instant gratification of a mall run, even in peak season.
4. Shopify Merchants Reached a New Record in Global Sales
Black Friday 2025 marked Shopify's best performance yet: merchants generated a record $14.6 billion across the BFCM weekend, up 27% from 2024's $11.5 billion (24% on a constant-currency basis). More than 81 million customers worldwide bought from Shopify-powered brands.
.avif)
At its peak - 12:01pm EST on Black Friday - merchants processed $5.1 million per minute. The average cart value reached $114.70, up from $110.71 in 2024, and Shop Pay was used for 32% of orders, growing 39% year over year.
Two more numbers worth your attention as a seller: over 15,800 entrepreneurs made their first-ever sale during BFCM 2025, and more than 94,900 merchants had their highest-selling day ever. The window rewards stores that are ready - as Podbase's Justina puts it: "The sellers who win a launch are the ones who have their designs and product pages ready weeks before - not the ones scrambling after." The same readiness rule that applies to product launches applies doubly to BFCM.
5. "Buy Now, Pay Later" Boosted Online Sales
According to Adobe, "Buy Now, Pay Later" services drove a record $1.03 billion in online spend on Cyber Monday 2025 - up 4.2% from 2024 and the first time BNPL crossed $1 billion in a single day, accounting for more than 7.2% of the day's online sales.
.avif)
Black Friday 2025 added another $747.5 million in BNPL spending (about 6.3% of the day's digital sales), and across the full holiday season BNPL contributed $20 billion, up 9.8% year over year.
Furthermore, most BNPL purchases were made on mobile devices - over 80% of the season's BNPL transactions happened on smartphones. This shift highlights how shoppers are turning to their phones for convenience and quick checkouts.
Also Read:
Amazon Statistics: Key Numbers You Should Know
Dropshipping Statistics: Key Trends & Industry Insights
6. Top-Selling Products & Categories on Black Friday
Consumer electronics were the top-selling category of the Black Friday 2024 period, accounting for 49% of the total items sold - smartwatches, laptops, and smart TVs - and electronics led again in 2025 alongside fashion and home goods.
.avif)
Besides electronics, fashion and apparel also attracted shoppers. These Black Friday statistics show that people are most excited about deals on tech gadgets, but they still love updating their wardrobes too.
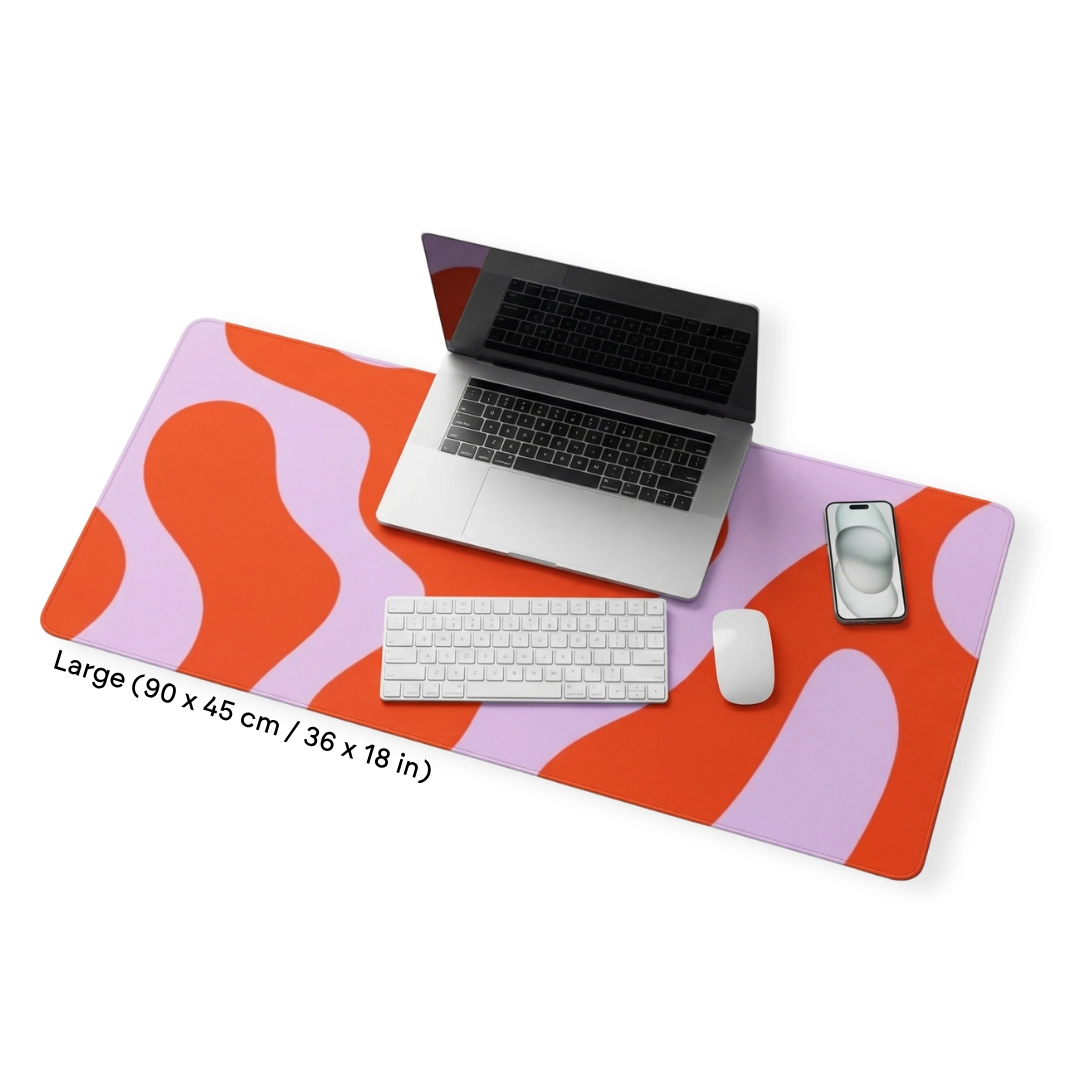
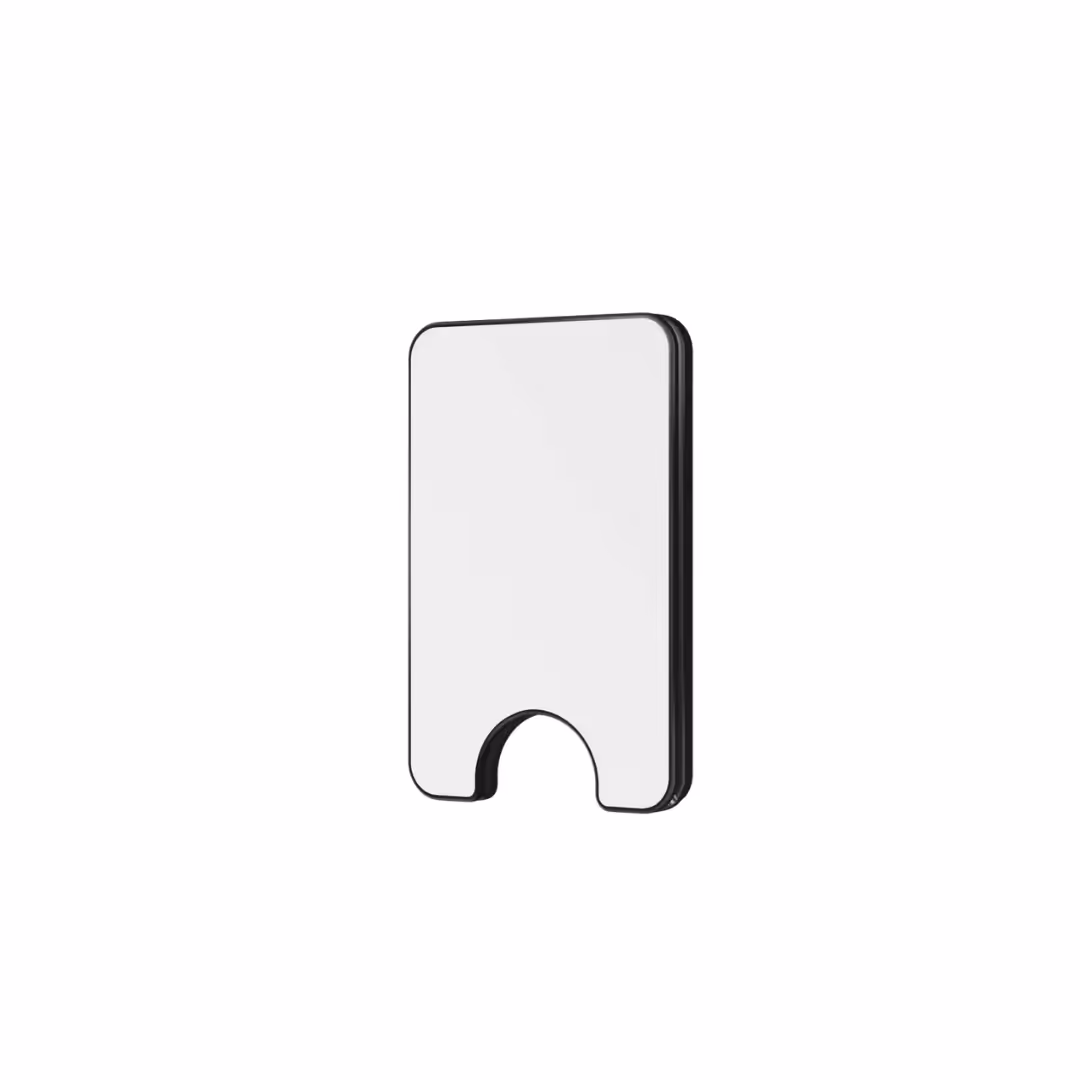
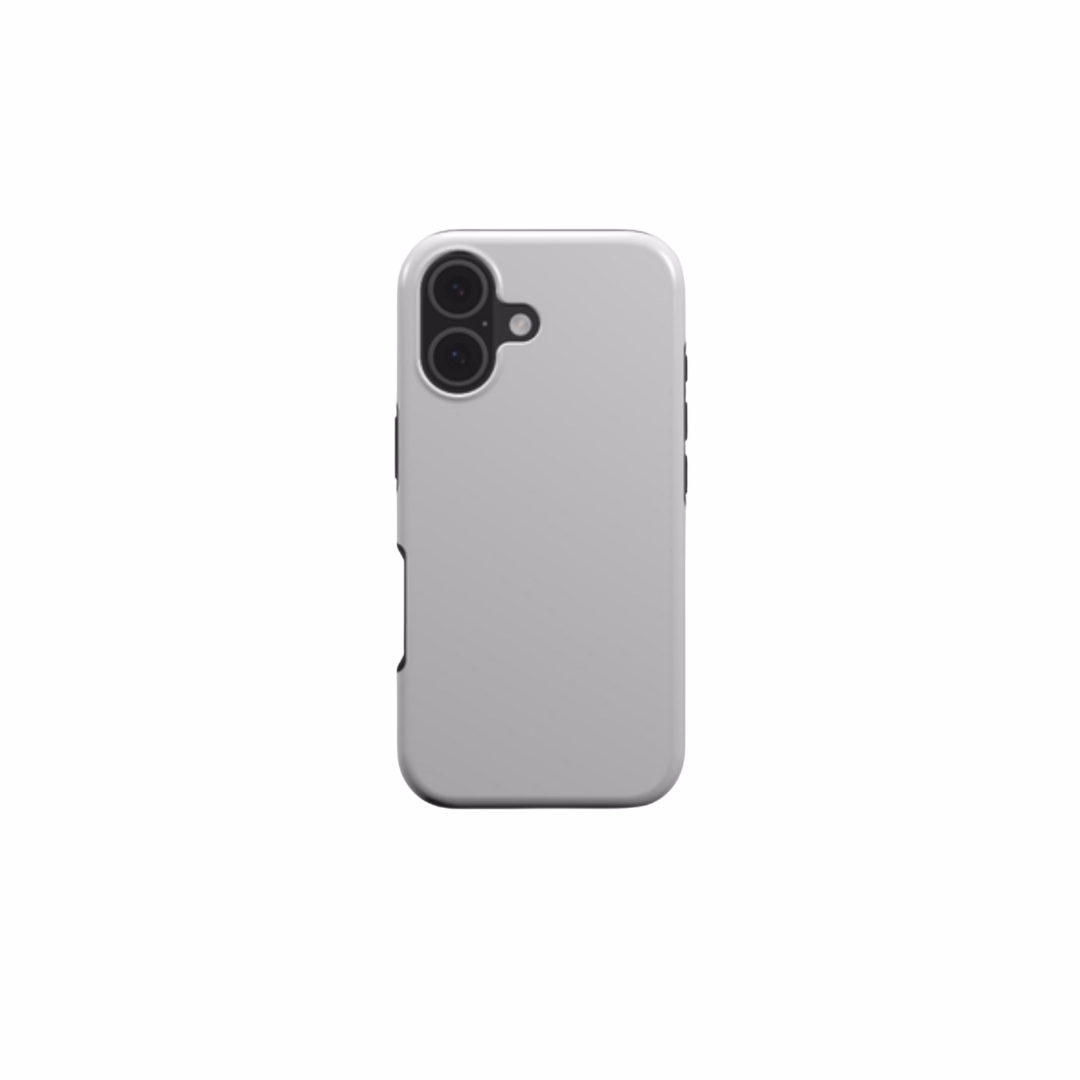
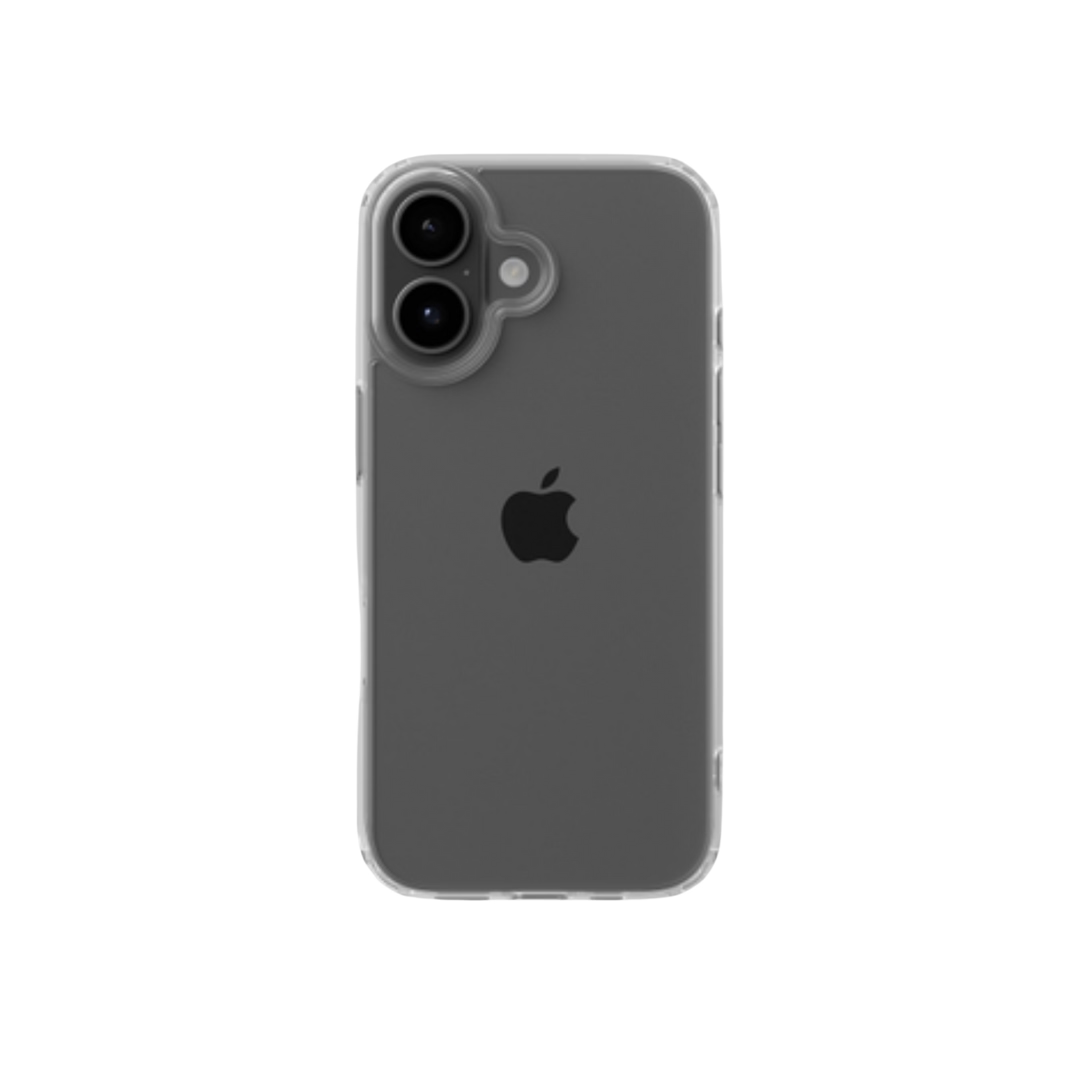
Here's the angle most sellers miss: every electronics purchase creates an accessories purchase. A new phone needs a case; new AirPods need a case; a new laptop needs a sleeve. POD sellers can't compete with Best Buy on TVs - but custom tech accessories ride the same 49% wave, with personalization as the differentiator. It's also a measurable upsell: Podbase sellers see 3-10% attach rates on accessories like screen protectors, at roughly 10 EUR of additional profit per attached item.
7. When Do Shoppers Actually Start Their Black Friday Shopping?
Over half of shoppers start their Black Friday buying a week early. Many people don't wait for the actual day because they want to grab the best deals before items sell out. Some stores also start offering discounts early to attract more buyers.
.avif)
Black Friday growth statistics also show that many shoppers start as early as 5 a.m. - up to 33% of shoppers do their Black Friday shopping early in the morning, as soon as stores open. And the macro data agrees: Adobe found Black Friday growth outpacing Cyber Monday for the second straight year because demand keeps shifting earlier.
For a made-to-order brand, this changes the calendar. If half your buyers are shopping the week before, your designs, listings, and promotions need to be live by mid-November at the latest - our team's consistent observation is that sellers lose more revenue to late launches than to imperfect designs. Don't spend October in the guessing phase; publish and let early traffic tell you which designs to push.
8. Who's Shopping on Black Friday? A Demographic Breakdown
Black Friday is popular among all age groups, but a majority of Black Friday shoppers in 2024 were middle-aged consumers, accounting for up to 33% of all shoppers. Millennials were the smallest group, accounting for 24% of shoppers.
.avif)
The seller takeaway: don't design only for the demographic you belong to. As our CMO puts it: "Generic designs lose to specific designs every time - the seller who makes products for one well-defined buyer outsells the one who makes products for everyone." A 45-year-old buying gifts and a 25-year-old buying for themselves respond to completely different designs, and Black Friday traffic includes both.
Also Read:
Entrepreneur Statistics: Insights for Business Builders
Top Ecommerce Statistics You Must Know
Final Thoughts: Top Black Friday Facts You Must Know in 2026
Black Friday statistics for 2026 point one way: this year is poised to be even bigger. Online spend has set a record three years running, mobile now drives the majority of revenue, BNPL just crossed $1 billion in a day, and demand keeps shifting earlier into November.
For print-on-demand brands and creative entrepreneurs, these Black Friday statistics aren't just numbers. They're signals of where demand is growing and how to plan smarter campaigns. Also check out when is Black Friday this year.
Whether it's testing print-on-demand designs early, optimizing online stores for mobile, or offering flexible payment options, the brands that act on data will stand out. With Podbase, your store is BFCM-ready by default: products ship in about 23 hours even in peak season, sellers who migrated saw about 30% fewer order-issue tickets (which matters most when volume spikes), and margins run up to 100% higher than with typical POD providers - so a record weekend actually shows up in your profit, not just your revenue.
Start for free with Podbase and get your store ready before the early shoppers arrive.

Saulius Meilutis is the CEO of Podbase, helping creators and entrepreneurs monetize their ideas with print-on-demand. He shares insights on eCommerce, growth, and building lean online businesses.

.avif)

.avif)


.avif)
.avif)
.avif)


.avif)
.avif)
.avif)


.avif)
.avif)

.avif)


.avif)

.avif)