
Mobile usage statistics in 2026 tell one clear story: the buyer journey is mobile-first from discovery to checkout. There are more than 4.9 billion smartphone owners worldwide, the average person spends about 4 hours and 37 minutes a day on their phone, and U.S. shoppers check theirs roughly 186 times daily. For a print-on-demand business, those habits shape everything from ad design to checkout flow.
Knowing where and how your audience browses, clicks, and abandons carts helps you optimize your print-on-demand (POD) store for mobile — and, as we’ll show, it points to a product opportunity most sellers miss. Here are the latest worldwide mobile phone usage statistics, refreshed for 2026, and what each one means for your store.
Here’s the 2026 picture at a glance before we break down each stat:
What Are Mobile Data Usage Statistics?
Mobile data usage statistics reveal how often and how long people use their devices, and what they do on them — from daily screen time to app downloads and mobile web traffic. The headline number sets the tone: mobile devices now drive roughly 60% of global website traffic in 2026 (about 52% from phones alone, excluding tablets, in Q1 2026 per Statista), so most of your visitors arrive on a small screen.
1. How Many People Own a Smartphone?
Smartphone owners have reached more than 4.9 billion globally in 2026, while unique mobile users have passed 5.8 billion — about 70% of the world’s population. Most of them browse, shop, and buy directly from their phones. For POD businesses, that means your product pages, ads, and checkout must be fast and responsive on mobile, or you lose buyers at every stage.
.avif)
2. Smartphone Market Share
By web-usage share, Apple leads the global smartphone market at about 32% in 2026, followed by Samsung near 19% and Xiaomi third. By units shipped the race is tighter — Apple finished 2025 first with a record 247.8 million units (a 19.7% share), with Samsung close behind and edging ahead in early 2026. Either way, the design cue is the same: shoppers expect sleek, fast experiences, so make sure mockups and checkout look flawless across iOS and Android, and test on both Safari and Chrome.
.avif)
3. How Many Americans Have a Smartphone?
As of 2026, about 91% of U.S. adults own a smartphone and 98% own a cellphone of some kind, according to Pew Research. In other words, nearly every American with buying power is always online. If you target the U.S. market, optimize for fast loading, easy scrolling, and one-tap checkout, and reach buyers where they already are with SMS marketing, mobile ads, and app integrations.
.avif)
Also Read:
- Black Friday Stats: Insights for Print-on-Demand Brands
- The Best Time to Post on Instagram
- Smartphone Usage Statistics: Essential Data for 2026
4. U.S. Smartphone Market Share
In 2026, Apple dominates the U.S. market: about 57% of American smartphone users carry an iPhone, and iPhones make up roughly 62% of new U.S. smartphone shipments. That means most American shoppers experience your store on iOS. Make sure your site runs smoothly on iPhone, loads fast, and supports Apple Pay for frictionless checkout, with clean layouts and tap-friendly buttons.
.avif)
5. Time Spent on Mobile Devices
In 2026, the average person spends nearly 4 hours and 37 minutes a day on their smartphone, fueled largely by short-form video like Reels and TikTok. That’s hours of scrolling, browsing, discovering products, and checking out on mobile every day — so invest in mobile-first marketing, fast load times, and product visuals that look great on small screens.
.avif)
6. Mobile Device Statistics: Traffic
As of 2026, mobile devices drive roughly 60% of all web traffic globally — about 52% from phones alone (excluding tablets) in Q1 2026, and higher in mobile-first regions like Asia and Africa. To keep those visitors, use responsive design, compress images, minimize JavaScript and CSS, and test your store on multiple phones.
.avif)
7. Time Spent on Mobile Digital Media
U.S. adults spend roughly 4 hours a day on mobile digital content — apps, video, social media, and browsing. Consumers increasingly lean on their phones for both entertainment and shopping, so align your marketing with how they actually consume: short-form video, mobile ads, and influencer content that’s snappy, visual, and mobile-first.
.avif)
8. Most Popular Phone Brands
In 2026, Apple, Samsung, and Xiaomi dominate global mobile usage. Apple finished 2025 as the world’s leading smartphone brand by full-year shipments, with Samsung a close second and trading the quarterly lead in early 2026, and Xiaomi third. For POD, that means testing your store and ads across the most common devices — iPhones, Galaxy models, and Xiaomi phones — and using device analytics to tailor the mobile experience.
.avif)
9. Mobile Shopping Statistics
U.S. mobile commerce reached an estimated $577.6 billion in 2025 and is projected to approach $860 billion by 2027 — it nearly tripled between 2019 and 2024. More people now browse, select, and buy entirely on their phones, so offering mobile payment options like Apple Pay streamlines checkout, reduces cart abandonment, and lifts conversions.
.avif)
10. Mobile Phone Habits
According to Reviews.org, the average American now checks their phone about 186 times a day in 2026 — roughly once every five waking minutes (down about 9% from 205 the year before). For POD businesses, that’s a stream of micro-moments to earn attention with a push notification, a retargeted ad, or a well-timed social post.
.avif)
What Mobile Usage Means for Print-on-Demand Sellers
Most mobile-stats roundups end with the same advice: make your store mobile-friendly. That’s necessary, but for print-on-demand sellers it misses the bigger point. When people spend 4h 37m a day on a device they glance at 186 times, the phone isn’t just the channel — it’s the canvas.
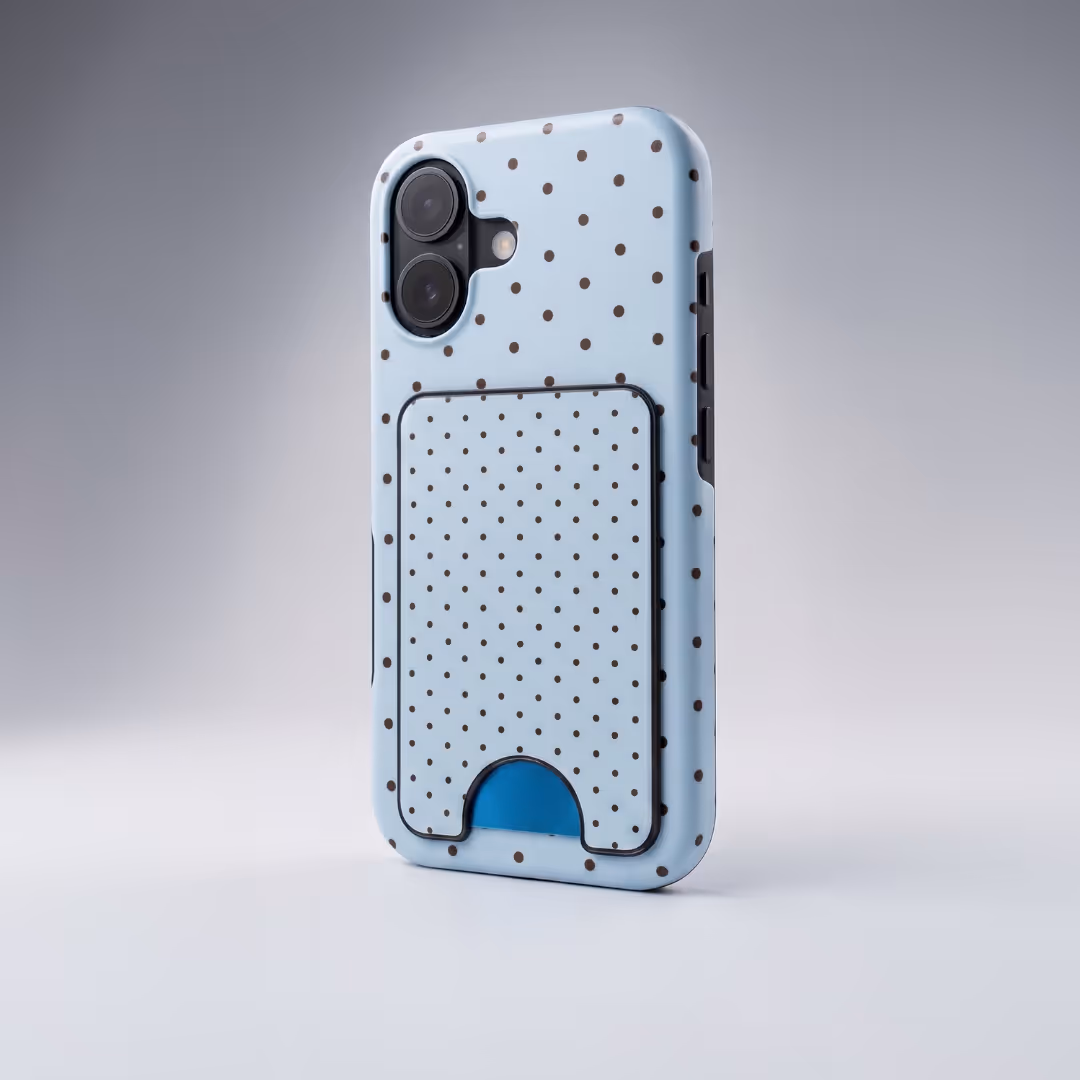
Our CEO, Saulius Meilutis, puts it bluntly: a phone case became “your personal billboard on your gadget,” and nearly 80% of phone users use a case. Multiply each new iPhone launch by that 80% and the addressable market for custom phone cases is enormous — the global phone case market alone is projected to reach $41.4 billion by 2030, and about 40% of Americans replace phone accessories every six months, so demand repeats.
The economics follow the attention. “You can buy from Podbase for 10 euro and sell them for 35-60 euro,” Meilutis notes, and a one-click checkout screen-protector upsell converts 3-10% of orders for roughly €10 of extra profit each. In other words, the same mobile saturation that forces you to optimize checkout also hands you POD’s most repeatable product line in tech accessories. For the deeper numbers, see our phone case sales statistics.
Also Read:
FAQ
1. How many people own a smartphone in 2026?
As of 2026, more than 4.9 billion people own a smartphone, and unique mobile users have passed 5.8 billion — roughly 70% of the global population, according to DataReportal. The vast majority browse, shop, and check out directly from their phones, which is why mobile-first design is now essential for online stores.
2. How much time do people spend on their phones per day?
People spend about 4 hours and 37 minutes a day on their smartphones globally in 2026, and in the U.S. roughly 4 to 5 hours. Americans also check their phones around 186 times a day, according to Reviews.org — nearly once every five waking minutes — creating constant micro-moments for brands to reach buyers.
3. What percentage of web traffic is mobile in 2026?
Mobile drives roughly 60% of global website traffic in 2026. Phones alone, excluding tablets, accounted for about 52% in Q1 2026 per Statista, with mobile-first regions like Asia and Africa running higher. For online stores, that means most visitors arrive on a small screen and judge your site on mobile speed and layout.
4. Which smartphone brand has the largest market share?
By web-usage share, Apple leads globally at about 32% in 2026 (StatCounter), followed by Samsung near 19% and Xiaomi third. By units shipped it’s tighter: Apple finished 2025 first with 247.8 million units and a 19.7% share, with Samsung close behind and edging ahead in early 2026.
5. How big is mobile commerce (m-commerce)?
U.S. mobile commerce reached an estimated $577.6 billion in 2025 and is projected to approach $860 billion by 2027 — it nearly tripled between 2019 and 2024. More shoppers now browse, choose, and buy entirely on their phones, so mobile checkout and wallets like Apple Pay directly affect your conversion rate.
6. Why do mobile usage statistics matter for print-on-demand sellers?
Because mobile is the entire buyer journey for print-on-demand. Shoppers discover products on phones, so visuals and checkout must be mobile-first — but the bigger opportunity is the device itself: nearly 80% of phone users use a case, making the phone a daily personal billboard and one of POD’s most repeatable products.
Conclusion
These mobile usage statistics all point the same way: business success depends on showing up where customers already are — on their phones — across every step of the buyer journey. For print-on-demand brands, that means a fast, mobile-first store and the products people actually carry all day. With Podbase, you can turn that mobile attention into sales with custom phone cases and tech accessories, no inventory required. Create a Podbase account today to get started.

Saulius Meilutis is the CEO of Podbase, helping creators and entrepreneurs monetize their ideas with print-on-demand. He shares insights on eCommerce, growth, and building lean online businesses.

.avif)

.avif)


.avif)
.avif)
.avif)

.avif)
.avif)
.avif)


.avif)
.avif)

.avif)


.avif)
.avif)

.avif)