
Are you struggling to grow your online sales, even though you offer high-quality products? The problem might not be your products but how shoppers interact with your store, especially on mobile.
Today, most shoppers use smartphones at every stage of the customer journey — browsing, ordering, reviewing, and even sharing products with friends.
Understanding the latest smartphone usage statistics helps you meet customers where they are. This data reveals their shopping habits. It tells you what they do online, how they discover products, and when they make purchase decisions.
For print-on-demand sellers, these insights can help design a mobile-first store and tweak your strategies to maximize mobile conversions.
In this guide, we’ll explore the latest smartphone statistics for 2026 and break down how each one impacts your POD business.
1. How Many People Have Smartphones in the World?
As of 2025, there are over 7.3 billion smartphones in use globally. That’s nearly equal to the world’s population, which currently stands at 8.23 billion. In other words, almost every POD customer you want to reach owns a smartphone.
Here’s what these smartphone stats mean for your print-on-demand business:
- You can reach potential buyers globally. Whether you sell on Etsy, Shopify, or WooCommerce, you can sell your products to anyone in the world.
- If your website isn’t designed for mobile shoppers, you’ll lose most of your audience. Your store should load fast, look great on mobile devices, and be easy to navigate on smaller screens.
- Mobile screens are bright and detailed. So, use high-quality mockups, images, and previews for custom products like phone cases, digital art, or drinkware.
Also Read:
2. How Many People Have Smartphones in the US?
Approximately 97% of Americans own either a smartphone or a feature phone in 2025. Out of this, 85% own smartphones, while 11% use feature phones.
Phones are a part of daily life in America. If your POD shop is mobile-ready, you can run a profitable POD business and easily reach active shoppers in the US.
Here's how to turn this mobile trend into sales:
- Use mobile-friendly communication channels like SMS, push notifications, and WhatsApp updates to market your products.
- Check how your store performs on different mobile devices, such as Android and iPhone.
- Most smartphone users spend hours on social apps. Share eye-catching designs and run paid ads on platforms like Instagram, TikTok, and Facebook.
3. Smartphone Market Share
Apple is the leading smartphone brand in the US, with a 57.79% market share. Samsung follows closely, with a 26.29% market share.
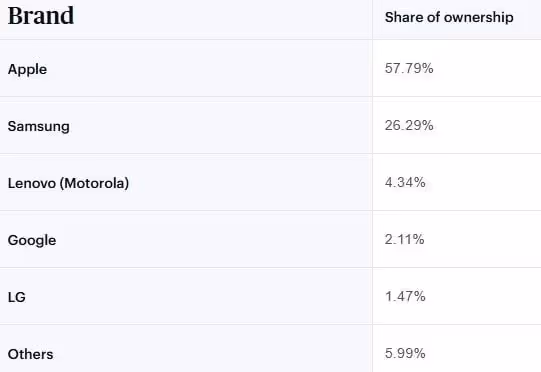
These smartphone usage statistics open up new targeting and design opportunities for your print-on-demand business.
Since Apple holds over half of the US market, most people shop using iPhones and iPads. That means your store should look and work perfectly on iOS. But remember to optimize your store for Android Samsung users as well.
Want to make and sell phone cases? Use these smartphone usage statistics to offer unique designs for both brands.
Here’s how:
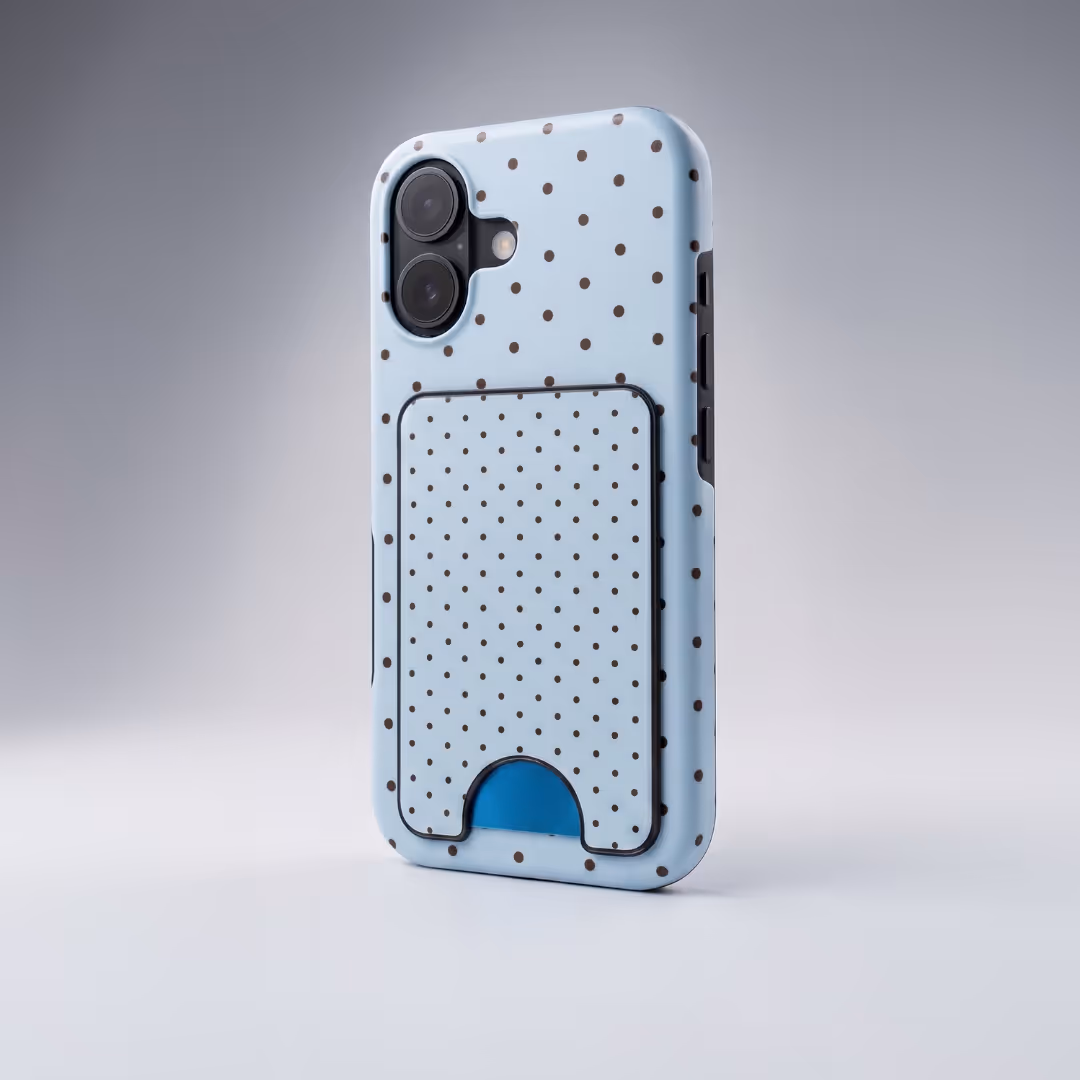
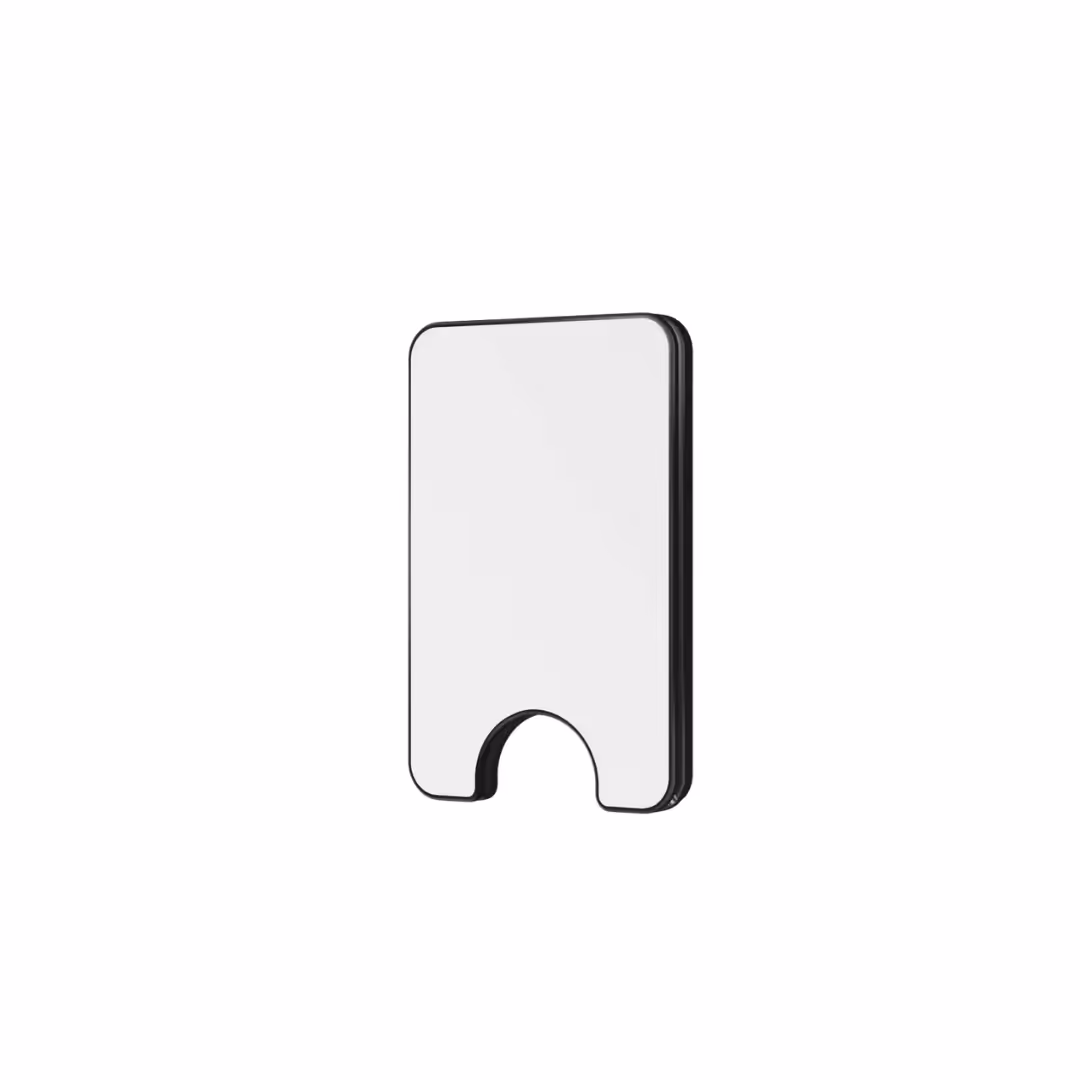
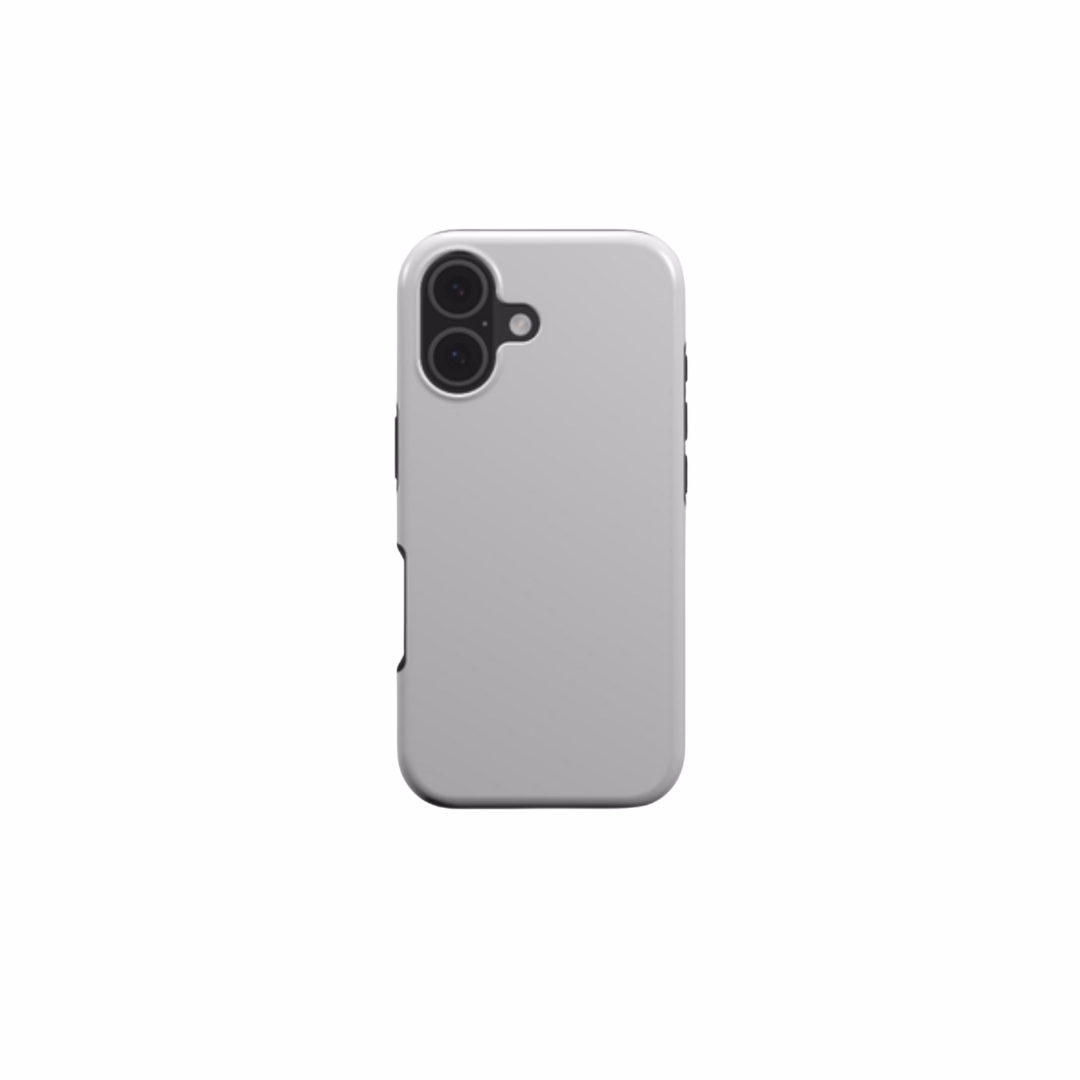
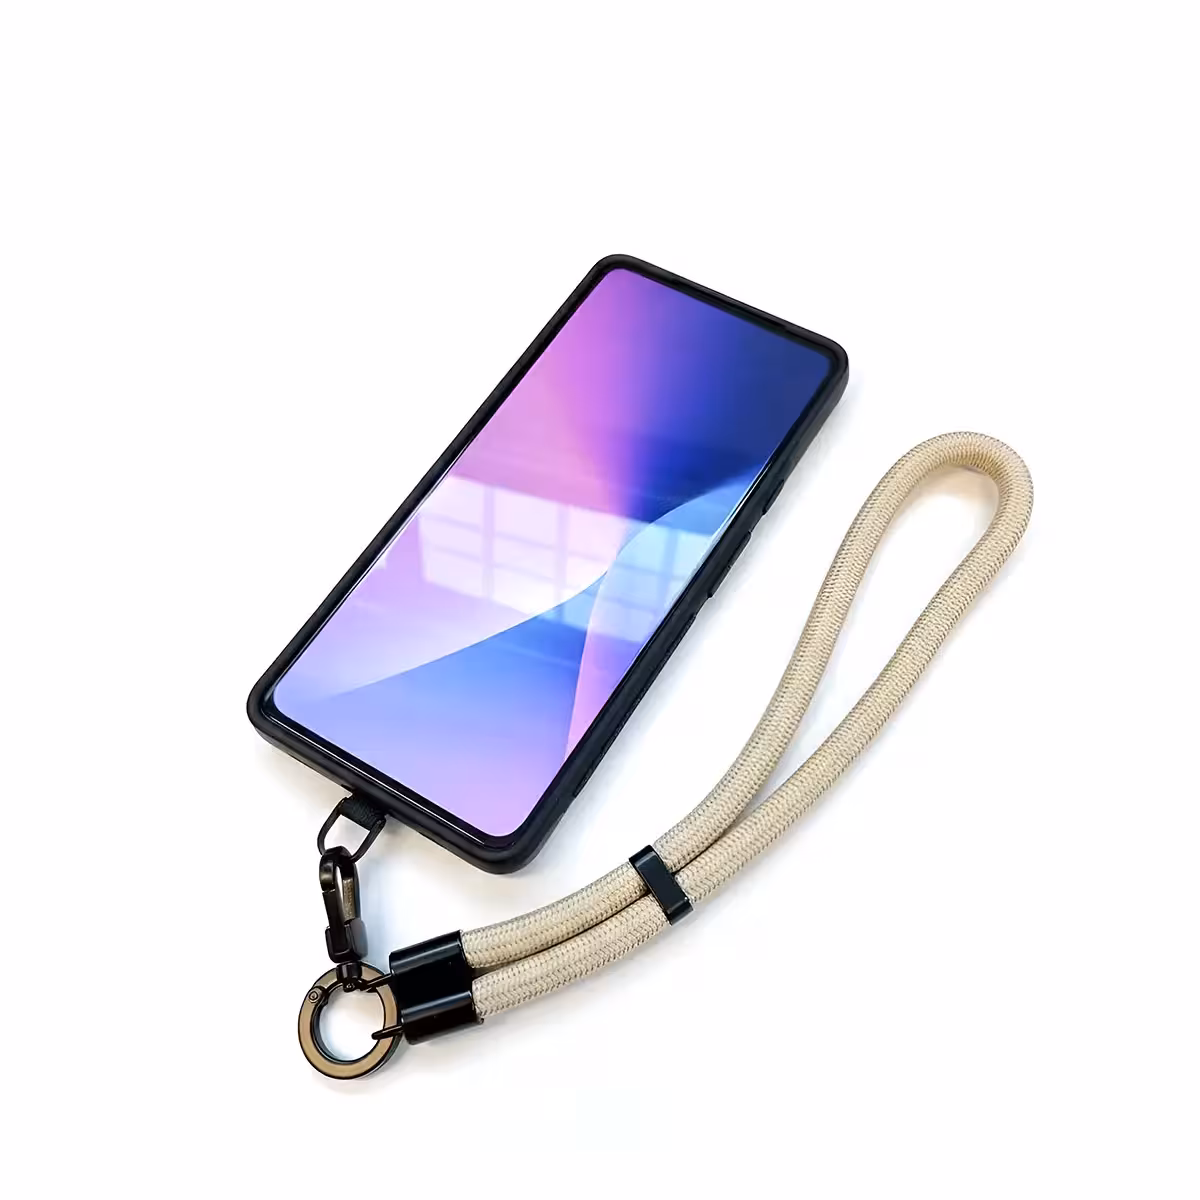
- Design personalized phone cases for iPhones and Samsung Galaxy models. You can try trending styles like minimalist quotes, floral and nature patterns, and more.
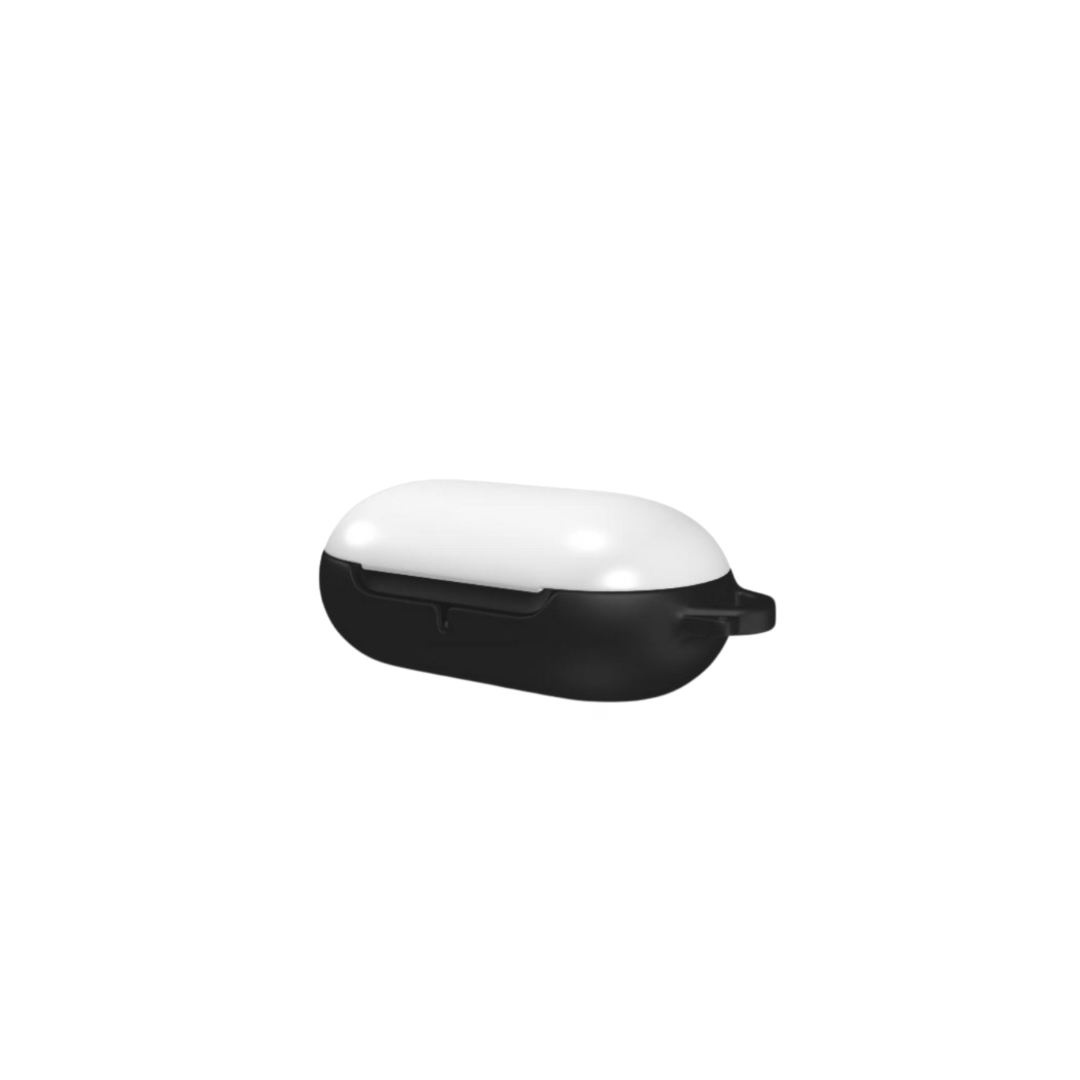
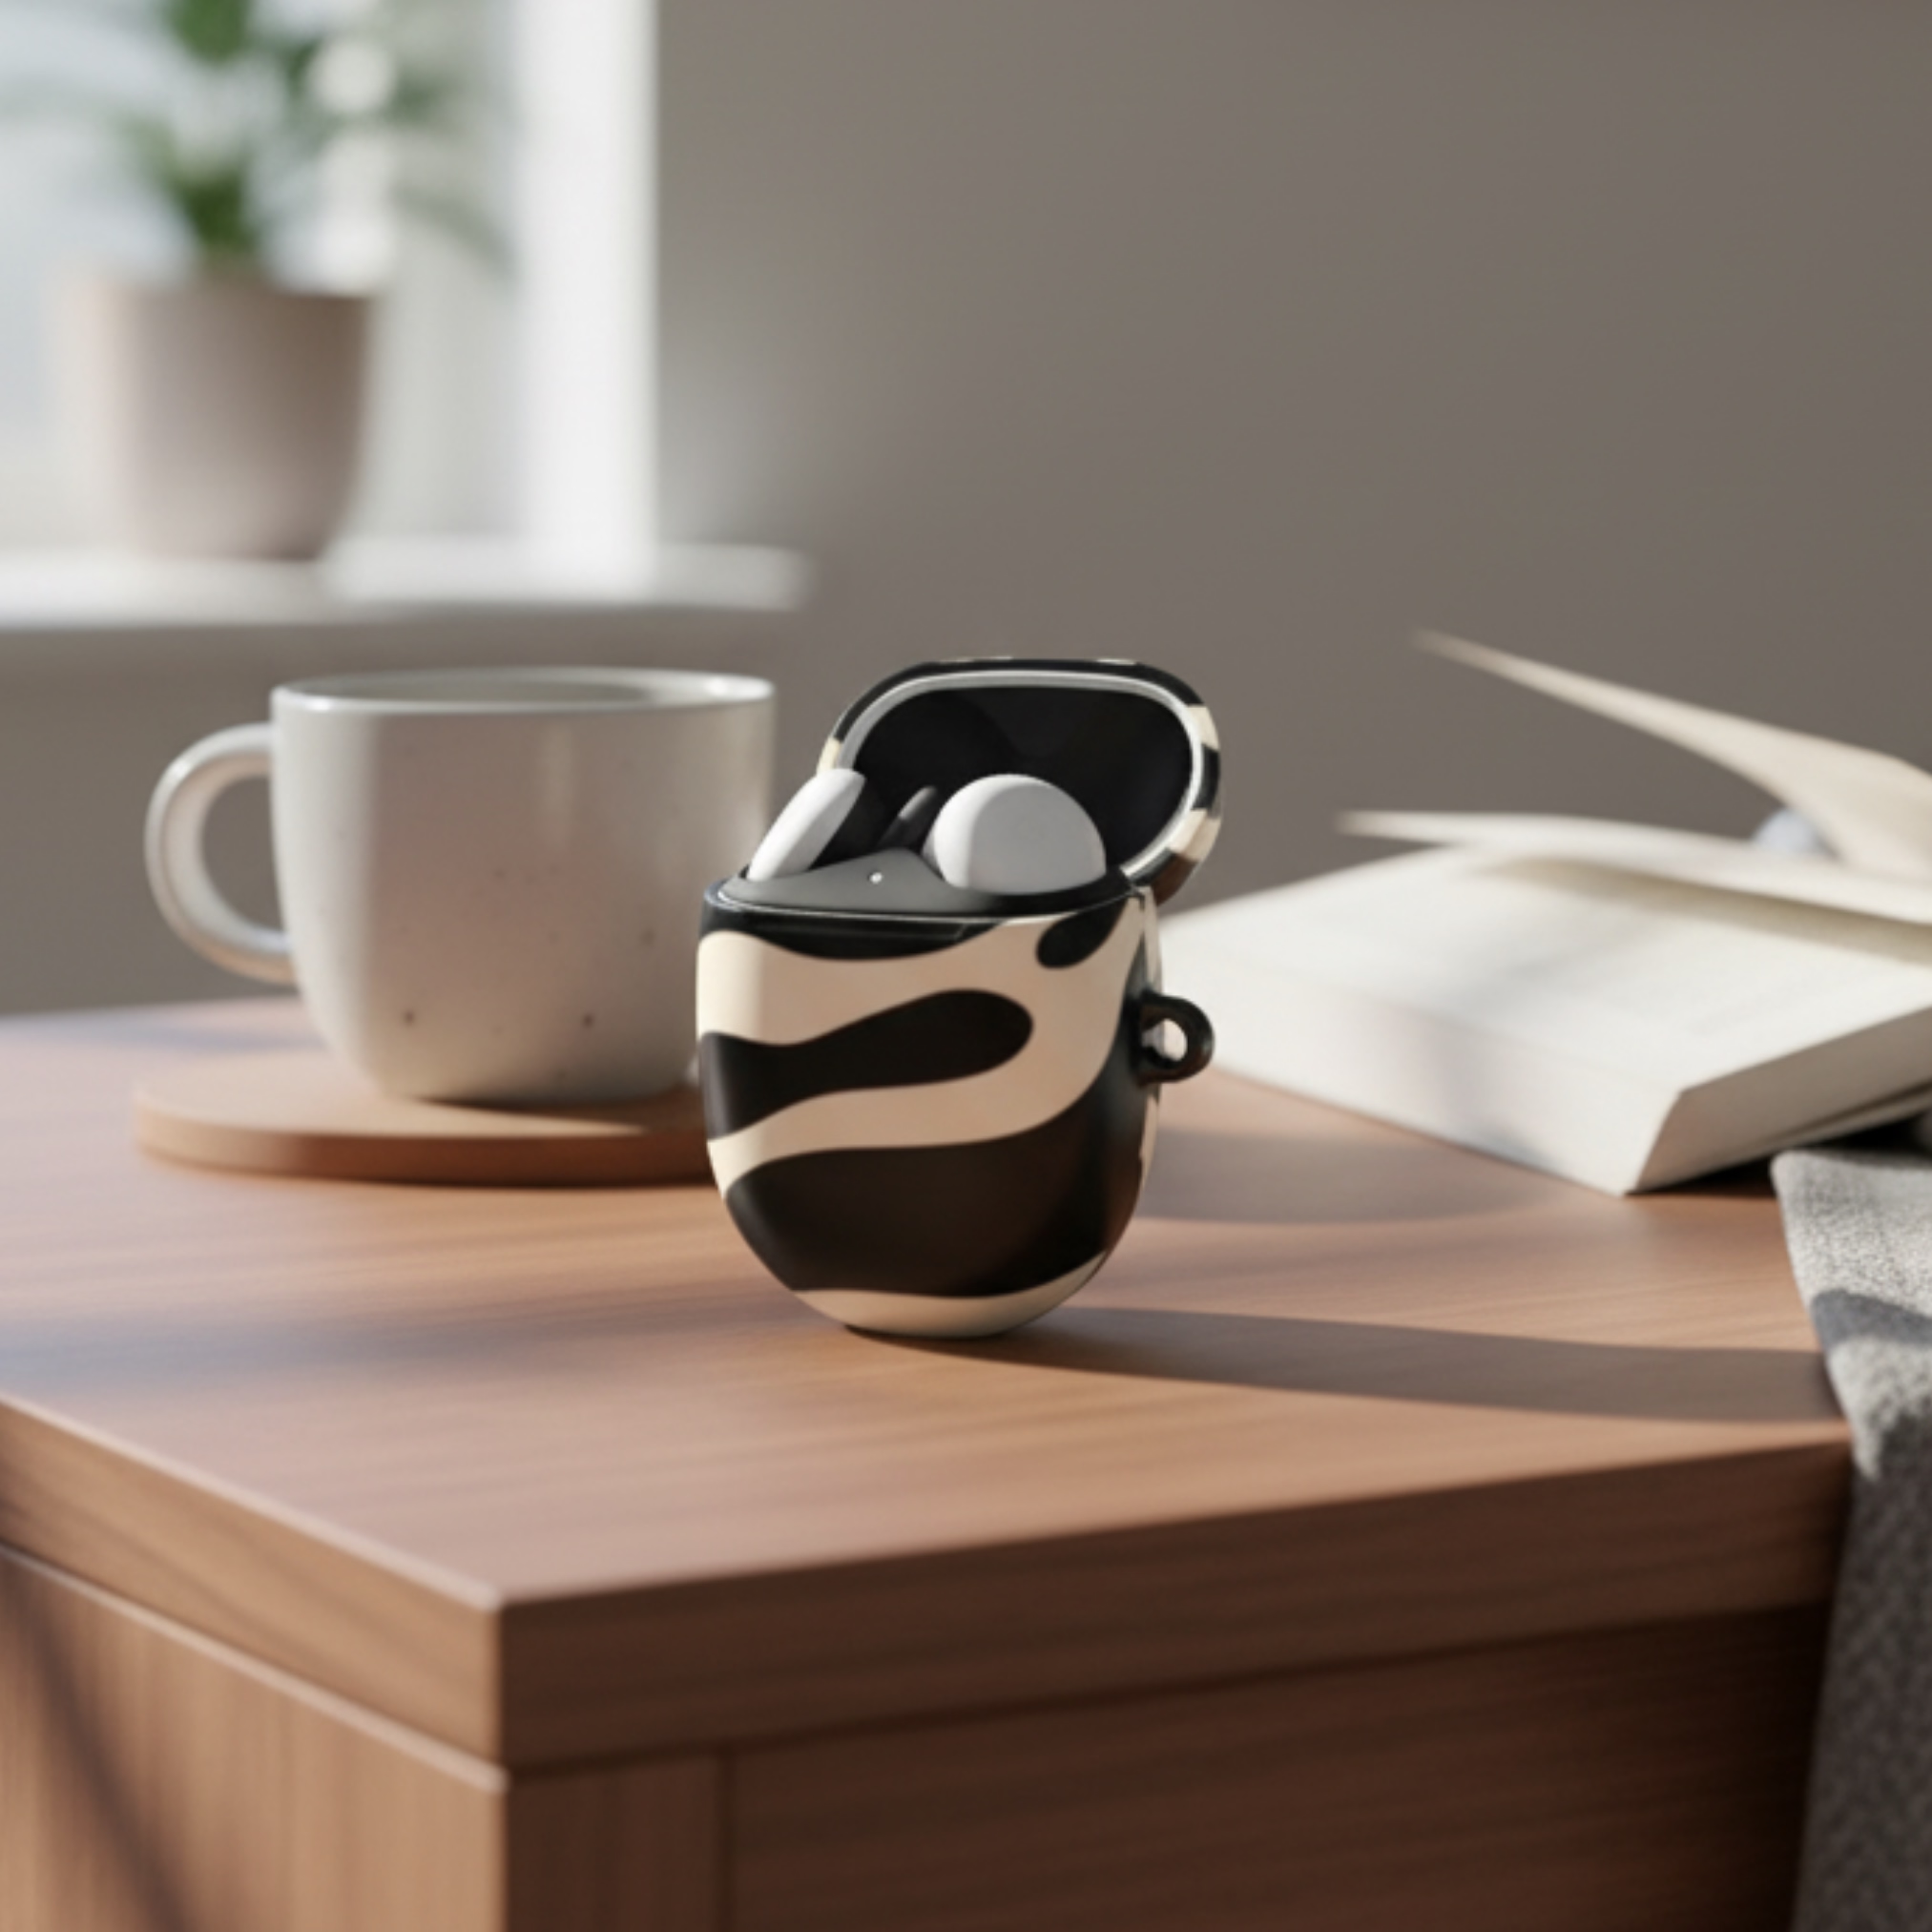
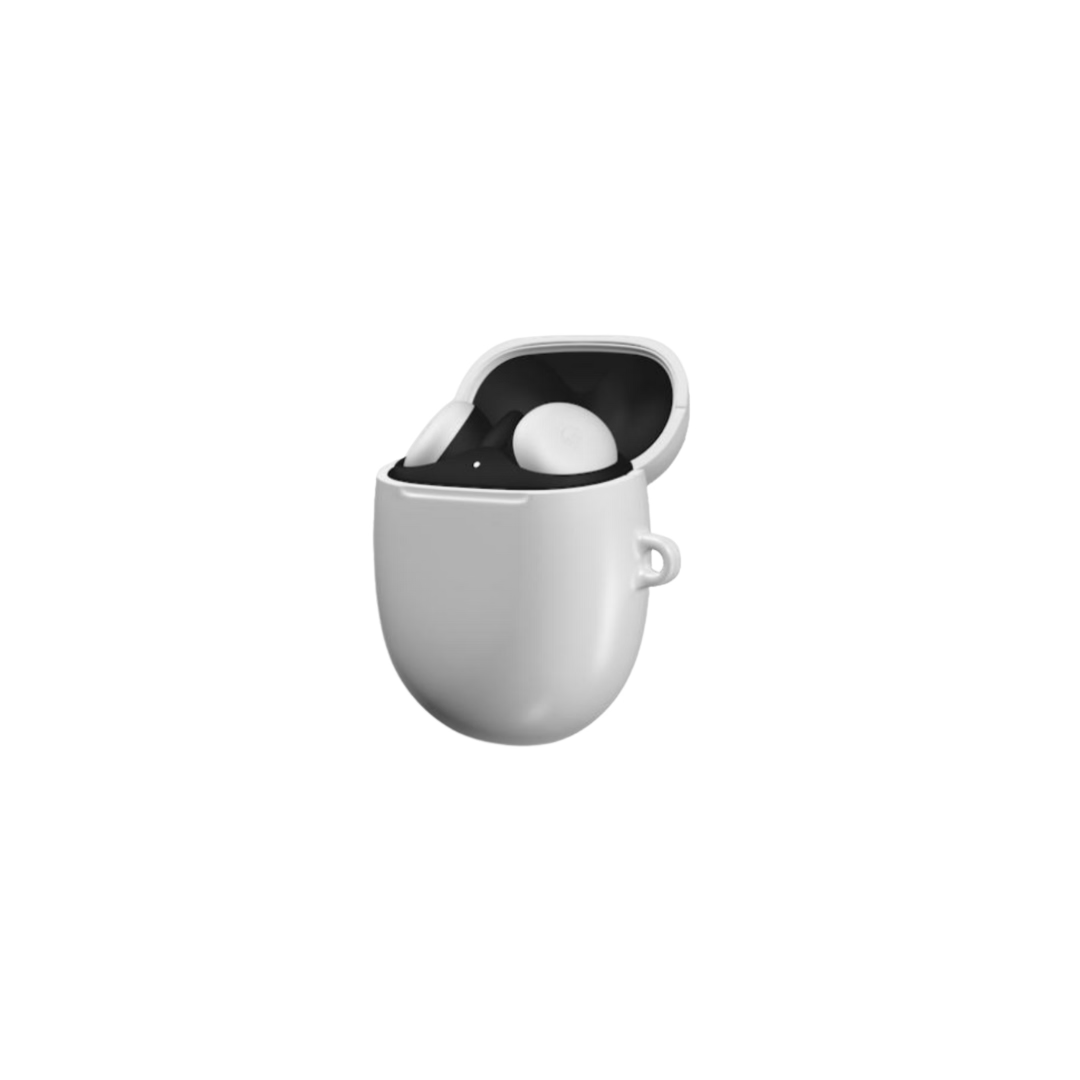
- Sell matching accessories, such as custom AirPods cases, screen protectors, and power banks.
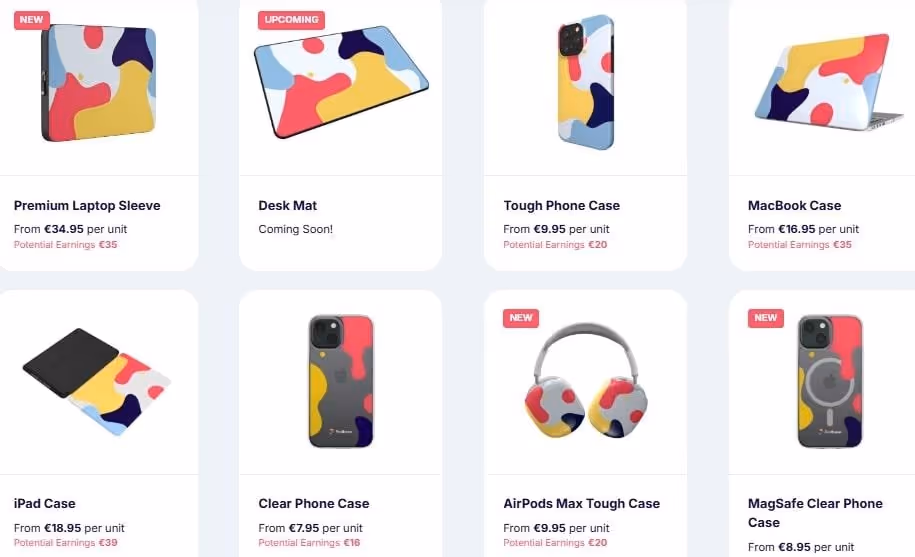
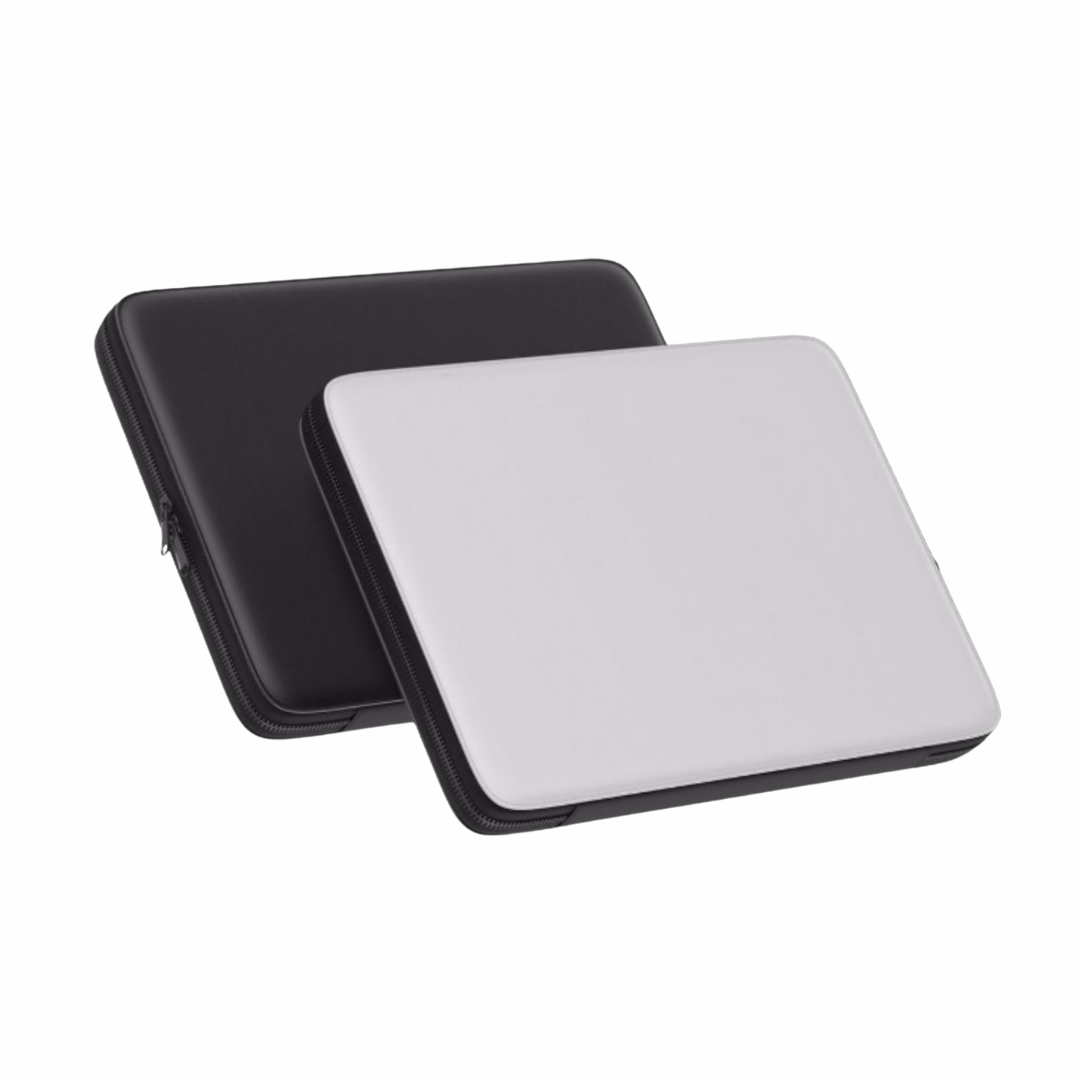
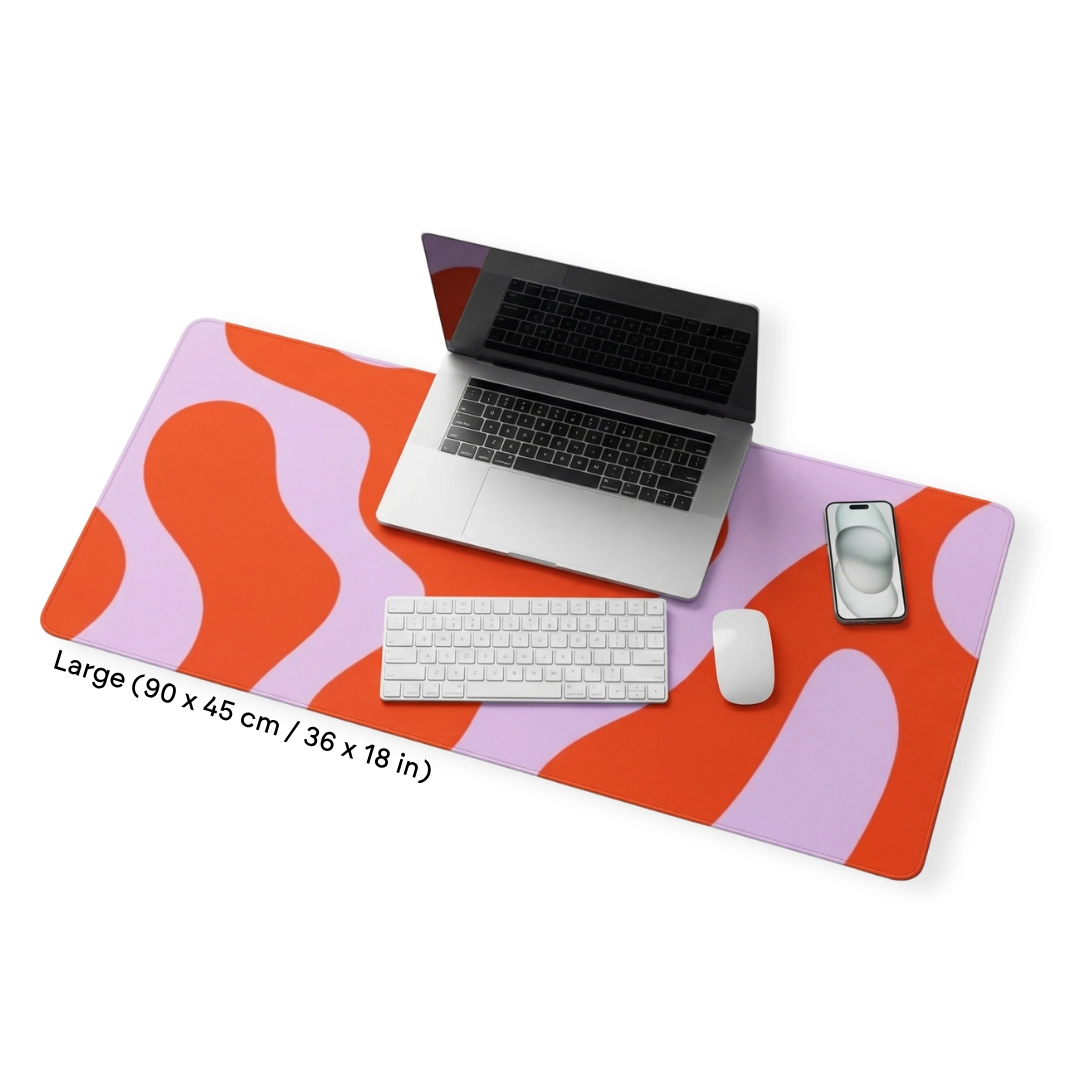
Here are some great examples of tech accessories from Podbase to inspire your designs:
Also Read:
- How to Scale Your Small Business: From 1 to 100 Sales
- How to Increase Sales: Go From 100 to 1,000 Orders Fast
4. How Often Do Most People Upgrade Their Smartphones?
About 55% of smartphone users replace their phones every 2 to 3 years. That’s over half of all smartphone users upgrading to newer models regularly.
For print-on-demand creators and business owners, these smartphone usage statistics reveal sales opportunities. Every phone upgrade creates a demand for new cases and accessories that match the new device.
Here’s how you can take advantage of these smartphone usage statistics:
- Launch new phone case designs with every major smartphone release to grab shoppers who want a stylish case.
- Offer bundle deals that include personalized phone cases and matching accessories to increase sales and average order value.
- Release limited-edition designs inspired by trending colors or styles from new phone models to create urgency.
5. Smartphone Users By Age
In 2025, 97% of US adults aged 18 to 29 own a smartphone. Older users also represent a growing market, with 76% of adults aged over 65 years owning a smartphone.
These smartphone usage stats show that Gen Z and young adults are your most active mobile shoppers. They love personalized products, viral trends, and easy checkout experiences.
They’re also more likely to talk about their purchases online, which increases word-of-mouth promotion for your brand.
Here’s how you can leverage these smartphone usage statistics to scale your small business:
- Create stylish designs built around specific interests and trends popular with younger adults.
- Market directly on social platforms they love, such as Instagram and TikTok. Use features that let them buy without leaving the app.
- Keep your content authentic. You can show behind-the-scenes videos, creator stories, and genuine customer reviews.
Also Read:
6. How Often Do We Check Our Phones on Average?
In 2025, the average person checks their phone 58 times a day. That’s almost once every 20 minutes.
For POD brands, each of those checks is an opportunity to get in front of your audience. Whether it’s a social post, a push notification, or a retargeting ad, you have 58 chances every day to make an impression.
Here’s how you can make the most of these smartphone usage stats:
- Regularly send push notifications to update potential customers about your best-selling POD products or limited drops.
- Use short, catchy headlines, emojis, or motion graphics to grab attention quickly.
- Share quick, engaging videos of your products in use on social media platforms.
- Use mobile-friendly retargeting ads to gently remind users about items they viewed but didn’t buy.
7. Time Spent on Mobile Devices
Most people spend 4 hours and 37 minutes on their phones daily in 2025. That represents nearly one-fifth of their waking hours.
This means customers have enough time to browse your catalog, read product reviews, and compare designs. It’s your window to attract attention, build trust, and convert browsers into buyers.
Here’s how you can leverage these smartphone usage statistics to grow your brand:
- Schedule your marketing posts and ads during peak mobile usage hours to maximize engagement.
- Run short, eye-catching flash sales promotions during those hours as customers often react fast to limited-time offers
- Share screenshots or short testimonials on your social media feeds to build trust among the customer base.
Also Read:
- Top Small Business Statistics You Should Know
- Phone Case Sales Statistics: Trends & Data for POD Store
Final Thoughts + Summary: Top Smartphone Usage Statistics You Must Know in 2026
These smartphone usage statistics reveal why some online stores thrive while others struggle. With nearly everyone browsing, shopping, and sharing from their phones, this is where your POD customers spend most of their time.
By truly understanding these trends, you can craft smarter marketing campaigns, deliver seamless mobile experiences, and turn casual scrollers into paying customers.
The opportunity is wide open, but only for businesses ready to adapt, personalize, and stay visible in this mobile-first world. Keep learning, optimizing, and engaging, and you’ll turn mobile traffic into long-term growth.
Ready to start selling smartphone-ready POD designs? Create a free Podbase account and build a thriving print-on-demand business.

Saulius Meilutis is the CEO of Podbase, helping creators and entrepreneurs monetize their ideas with print-on-demand. He shares insights on eCommerce, growth, and building lean online businesses.

.avif)

.avif)


.avif)
.avif)
.avif)

.avif)
.avif)
.avif)


.avif)
.avif)

.avif)


.avif)
.avif)
.avif)