
TikTok Shop lets you sell products directly through videos and a special shop tab. Customers can simply tap a product tag and buy items without ever leaving the app.
Many print-on-demand sellers now use TikTok Shop as a core sales channel - and the platform's growth numbers explain why. Podbase CMO Vytautas Mikaila puts it plainly: "Social media commerce is the number one place to sell your ecommerce products, especially print-on-demand products. I think that has already been the case for the last couple of years, and now even more so."
To grow your business, it is important to monitor TikTok Shop data. These numbers show how fast the platform is growing, how many people are buying, and which items sell best.
This article will help you understand these TikTok Shop statistics so you can grow your own POD brand in 2026.
TikTok Platform Fundamentals: Users, Reach, and Growth
How long has TikTok been around? Nearly a decade, with a growing global user base.
At the start of 2025, TikTok had around 1.59 billion global users. Experts believe this number will grow to 2.3 billion by 2029.
If you're wondering how many people use TikTok today, the app recorded 192.31 million downloads globally in Q2 2025 alone.
TikTok's revenue growth has been equally strong. In 2022, TikTok generated $4 billion in ad revenue. By 2026, that number is expected to be four times higher.
WARC's 2025 insights estimated that TikTok's global ad revenue could reach $32 billion if the platform avoided a U.S. ban, positioning it to capture roughly 11% of worldwide social ad spend.
Users also spend around 35 hours per month on TikTok globally, and almost 44 hours per month in the U.S.
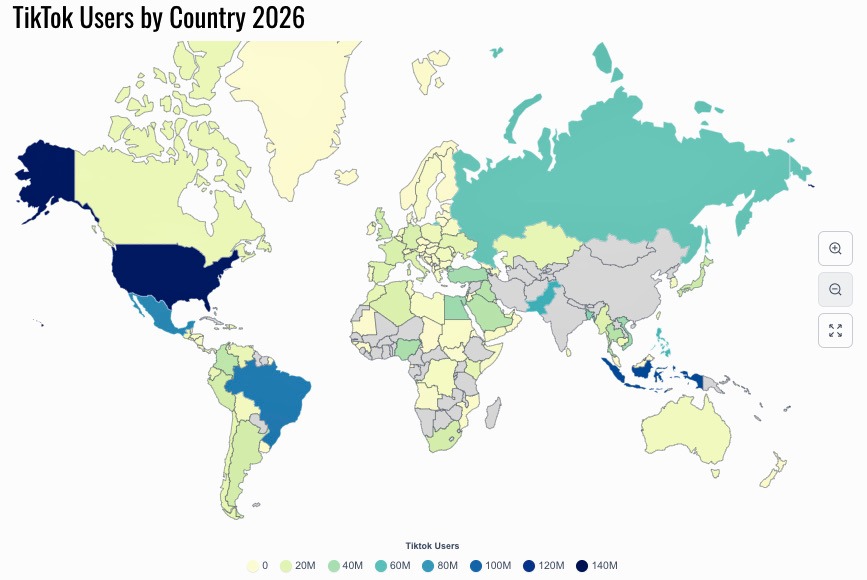
As of 2026, the largest TikTok user bases are found in:
- United States: 136 million
- Indonesia: 108 million
- Brazil: 91.7 million
In addition, look at these TikTok Shop statistics for age distribution percentages in the U.S. compared to other platforms:
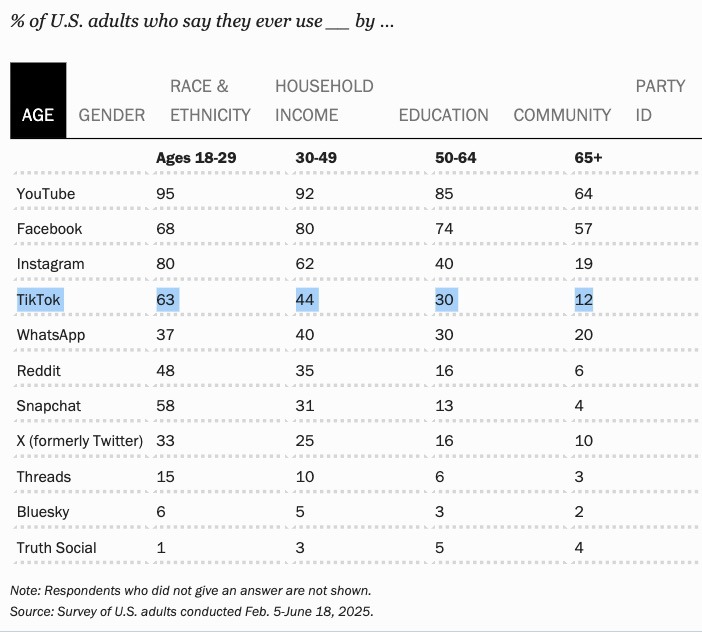
While many young people use TikTok, it is also reaching older adults. Let's explore more specific TikTok Shop statistics.
Also read:
What Is Print-On-Demand: Everything You Need To Know About It
How to Scale Your Small Business: From 1 to 100 Sales
The Death of the Marketplace? The TikTok Shop Explosion
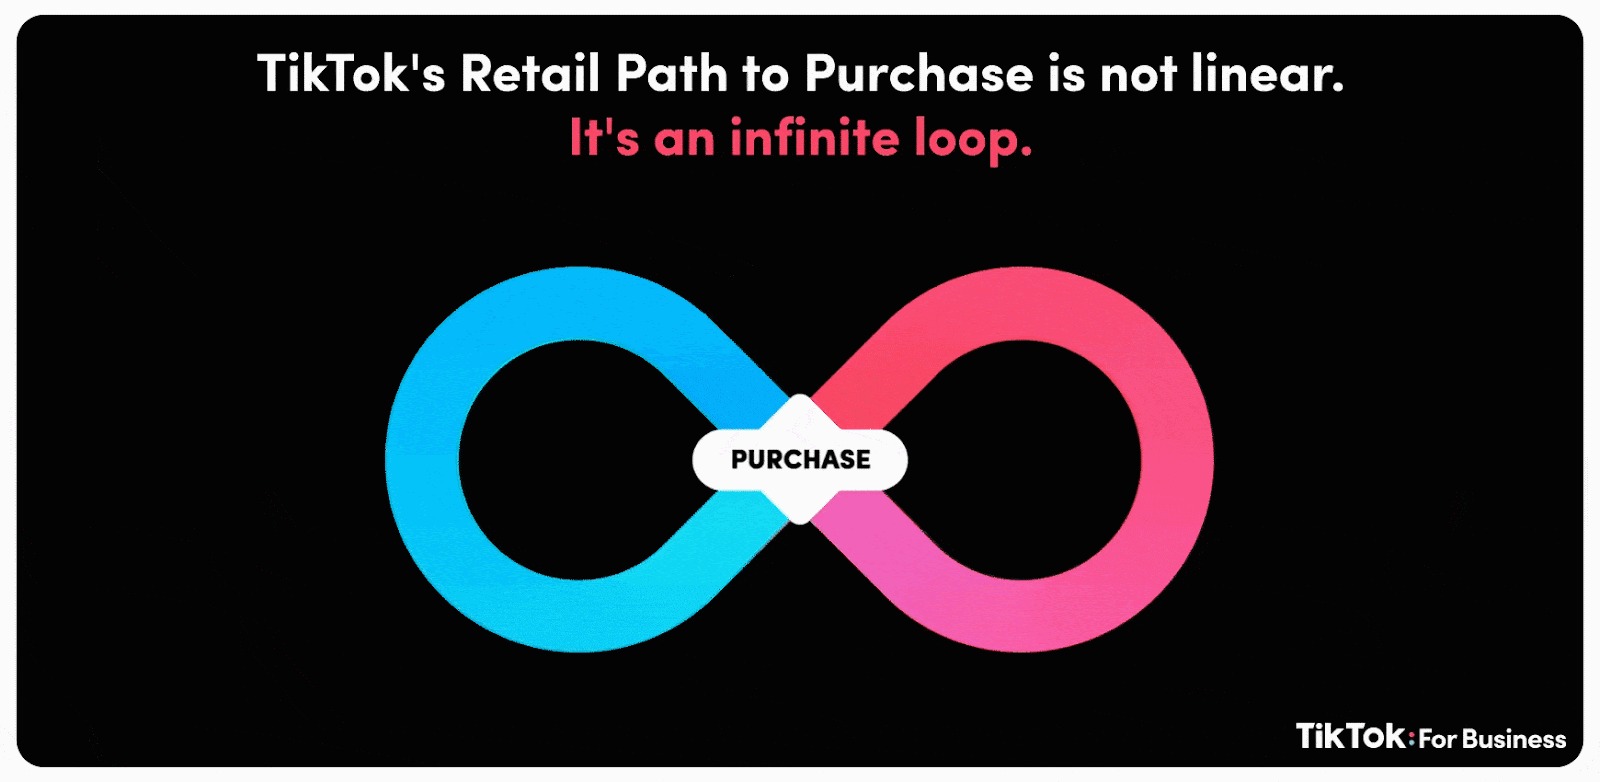
In traditional marketplaces, people search, compare options, and then buy. TikTok Shop statistics show a new pattern. Users buy products they discover unexpectedly.
Over 171,000 local and small U.S. businesses now sell on TikTok Shop. Small business sales have grown 70% year-over-year, reflected in recent TikTok Shop growth statistics.
Sellers offer more than 70 million products across 750+ different categories.
That said, TikTok is very strict about its rules. According to 2025 TikTok Shop statistics, 1.4 million registrations were rejected for failing compliance checks.
One thing that sets TikTok Shop apart is how quickly users convert. Discovery, evaluation, and purchase happen in one session. This loop removes delays common in search-based buying and helps explain rising TikTok Shop sales statistics.
TikTok Shop data also shows that:
- 83% of shoppers discovered a new product
- 70% of buyers discovered a new brand
- 76% of users who joined a TikTok Live session made a purchase
Additionally, look at how discovery-driven search is growing:
- 41% of Gen Z shoppers search on social platforms first, ahead of traditional search (32%)
- Across age groups, 37% of shoppers prefer social platforms for product research
- 76% of users say social media content influenced a recent purchase, rising to 90% for Gen Z
Also read: Mobile Commerce Growth Stats to Know for POD Store Owners | Is Print-On-Demand Profitable? An In-Depth Guide |
TikTok Shop for Print on Demand (POD) and Small Brands
TikTok Shop statistics highlight the rapid growth of its marketplace and the opportunities for POD sellers in apparel and other areas. Some of the best performing TikTok Shop categories are:
- Beauty and Personal Care: $2.49B GMV (22.5%)
- Women's wear and Underwear: $1.39B GMV (12.56%)
- Men's wear and Underwear: $893.54M GMV (8.06%)
- Home Supplies: $457.5M GMV (4.13%)
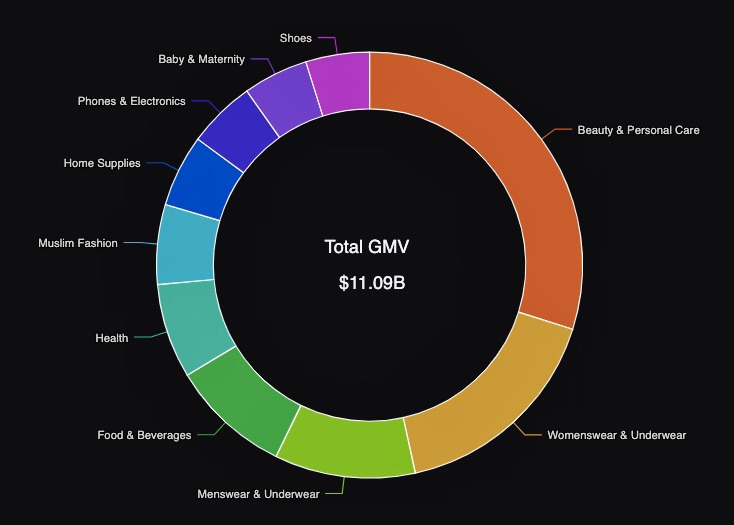
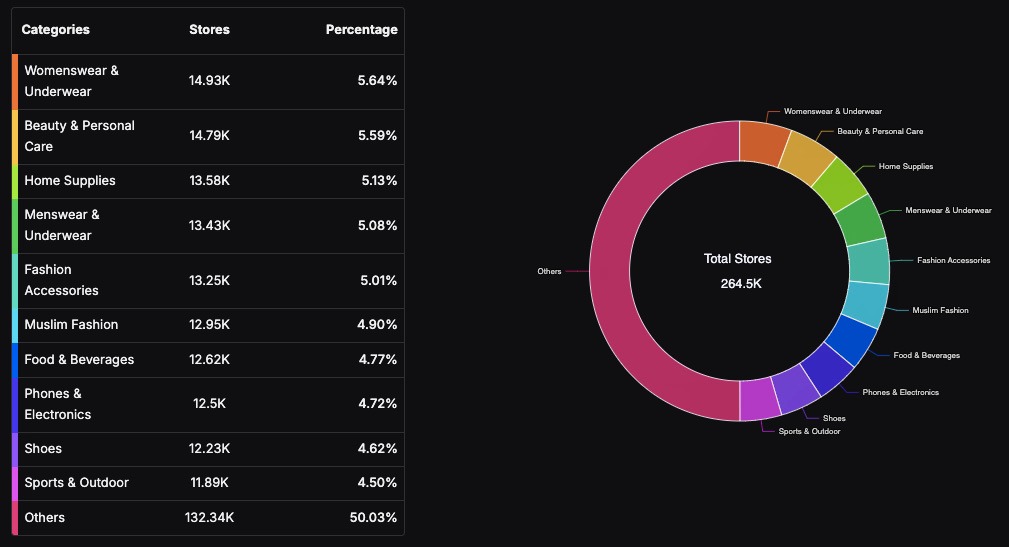
Among online shopping categories, women's wear and underwear have the most shops (5.64%), followed by Beauty & Personal Care (5.59%) and Home Supplies (5.13%).
These trends show strong potential for POD business owners selling clothing and home decor.
Based on 2024 data, TikTok Shop's average order value was $35, with 5.3 transactions per customer. This forms part of TikTok Shop seller earnings statistics.
While Etsy doesn't report an official latest average order value, its 2024 filings show:
- $12.6B in gross merchandise sales
- 89.6M active buyers
- About $121 GMS per buyer, slightly down from the previous year
TikTok Shop Is Additive - Not a Replacement
A common assumption among POD sellers is that TikTok Shop replaces Etsy or Amazon. Podbase's experience with its seller base suggests the opposite. Podbase CMO Vytautas Mikaila describes how TikTok Shop fits into a real seller's channel mix: "Especially now with TikTok Shop, this can expand your business revenue tremendously. If you are a retailer who is located within the markets where TikTok Shop operates, you should definitely give it a try, because in the right case it can unlock a completely new revenue stream and really boost your business in that sense."
The word "unlock" is deliberate. TikTok Shop reaches a buyer in a different mental state - passive discovery rather than active search - which means it captures sales that would never happen on Etsy or Amazon. For Podbase sellers already running paid social ads as their primary acquisition channel, TikTok Shop adds a complementary discovery loop rather than competing with their existing revenue streams. "Social can bring the attention very fast," says Mikaila, "but you still need the right product, the right creative, the right pricing, the right store setup, and the right understanding of your audience to convert that attention properly."
TikTok Shop sales are also driven by the affiliate program. For example, during Black Friday/Cyber Monday 2025, 159,000 creators drove affiliate sales across 108,000 shops.
eFor POD sellers, access to this creator ecosystem will help increase product discovery and scale businesses.
Also read: Print On Demand Design Ideas: What's Trending Now | TikTok Shop Fees: Commission, Refunds, and More
Consumer Behavior: Why 2026 Shoppers Prefer TikTok
TikTok Shop is one of the fastest-growing online retailers, and here's why:
- It saw a 131% yearly rise in shoppers
- 180% increase in revenue
One key TikTok Shop statistics insight shows how Gen Z finds products today. Social platforms are leading. TikTok accounts for 23.2% of product discovery for Gen Z shoppers, while Google sits at 18.8%.
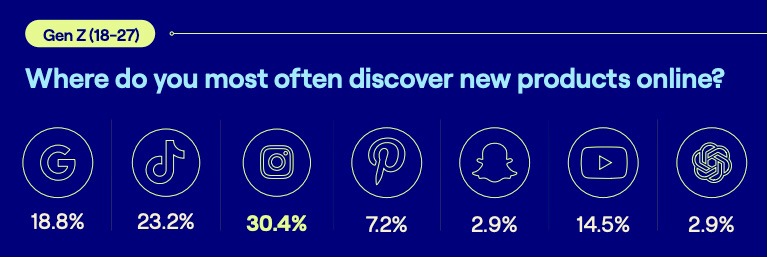
This shift happens for two reasons:
- Discovery on TikTok is intentional and organic
- Users search using keywords, and high-demand products also appear naturally on the For You Page
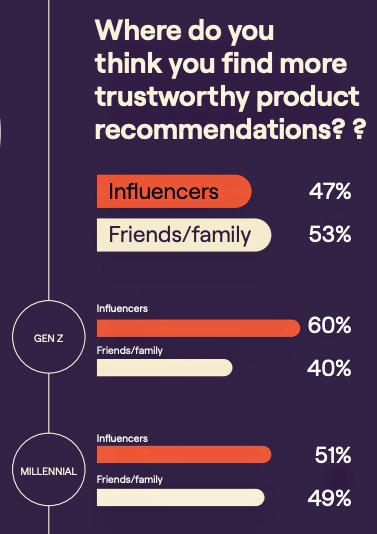
This makes creators feel like trusted peers. For instance:
- 62% of users say they bought a product after an influencer recommendation
- Nearly half of users trust influencers almost as much as friends and family
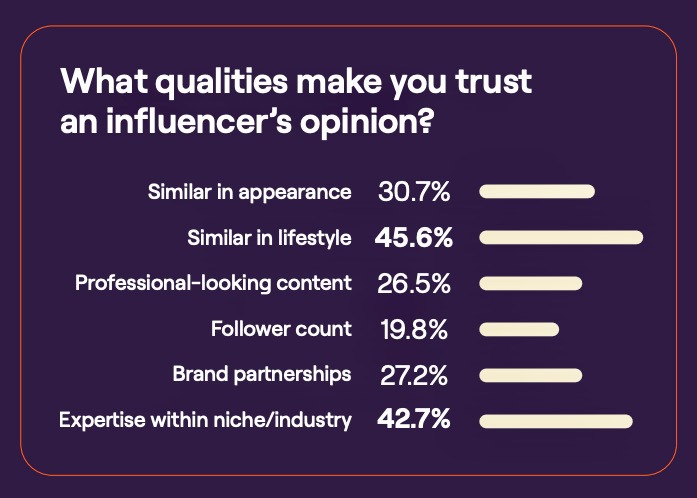
There are clear reasons why influencer recommendations feel trustworthy:
The Creator Strategy That Actually Works for POD Sellers
Most POD sellers approach TikTok creator partnerships as awareness plays - one sponsored post, a spike in views, then silence. Podbase CMO Vytautas Mikaila identifies a more effective approach: "What we have seen is that it works best when influencer or creator content is not treated like a one-post awareness play and that is it. It works much better when that content is also turned into performance creative. Then it starts working on two levels: first as trust and brand value, and second as ad creative that can drive actual purchases more efficiently."
In practice, this means the most valuable output of a TikTok creator collaboration isn't the organic post - it's the raw footage that can be repurposed into a paid TikTok ad. Authentic creator-filmed content consistently outperforms polished brand-produced creative on TikTok's ad platform, because the platform's algorithm surfaces content that looks native to the feed. A seller who treats creator content as production budget for paid ads - rather than free exposure - gets compounding returns: organic reach during the post's lifespan, plus sustained performance once it runs as an ad.
Mikaila's sequence for sellers is clear: "Unlock your paid media, social media, and ecommerce first. Only then look into influencers to build brand value and brand image." TikTok Shop's affiliate creator network is a more accessible entry point than traditional influencer deals - creators earn on commission, so the alignment of incentives removes upfront cost risk for smaller POD sellers.
Also read:
When Is Black Friday 2026? Dates, Deals, and E-Commerce Tips
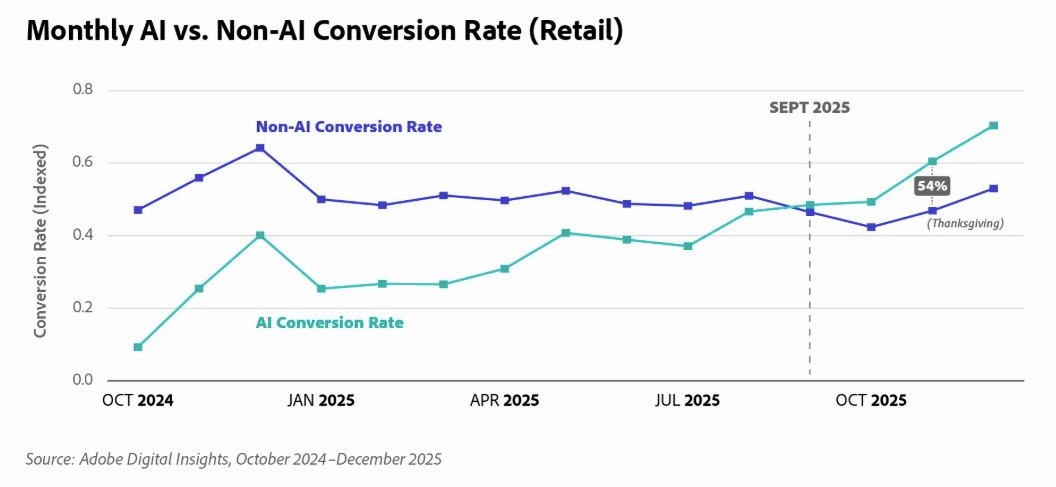
Future Outlook: Agentic Commerce on TikTok
Salesforce studied data in 2025 from 1.5 billion shoppers. It found AI influenced 20% of purchases and drove $67 billion in retail sales.
Additionally, AI referrals converted 31% more than non-AI sources and 54% more on Thanksgiving 2025.
These TikTok Shop statistics mean shoppers guided by AI were more likely to buy. For POD sellers on TikTok Shop, the implication is straightforward: product listings optimized for TikTok's AI recommendation engine - clear descriptions, specific keywords, strong creative signals - will capture disproportionate share of the AI-influenced discovery traffic that is now driving billions in retail sales.
Final Thoughts
TikTok Shop statistics show a platform that's growing fast, blending discovery, creators, and AI tools to drive purchases. These statistics help small brands and Print on Demand sellers understand how TikTok Shop works today.
The data confirms what Podbase sees in its own seller base: social commerce isn't hype. It's converting. The sellers who win on TikTok Shop are not simply listing products and waiting for the algorithm - they're combining the right products, well-optimized listings, creator partnerships that double as ad creative, and an existing paid social foundation to turn TikTok's discovery engine into a sustained revenue channel.
Be sure to keep up with TikTok Shop statistics 2026, test strategies, and explore product categories. Get started with Podbase to list products and start selling on TikTok Shop.
FAQ
1. How big is TikTok Shop in 2026?
Over 171,000 local and small US businesses now sell on TikTok Shop, offering more than 70 million products across 750+ categories, with small business sales up about 70% year over year. The platform itself saw a 131% yearly rise in shoppers and a 180% increase in revenue, on top of a global base near 1.59 billion users.
2. Does TikTok Shop replace Etsy or Amazon for POD sellers?
No - it is additive. TikTok Shop reaches buyers in a passive-discovery mindset rather than active search, so it captures sales that would never happen on Etsy or Amazon. For sellers already running paid social as their main acquisition channel, it adds a complementary discovery loop rather than competing with existing revenue. As Podbase's CMO puts it, in the right case it can unlock a completely new revenue stream.
3. What sells best on TikTok Shop?
By GMV, the top categories are Beauty and Personal Care (about 2.49 billion USD, 22.5%), Women's wear and Underwear (1.39 billion USD, 12.56%), Men's wear and Underwear (893.54 million USD, 8.06%), and Home Supplies (457.5 million USD, 4.13%). Women's wear has the most shops. For POD sellers, the apparel and home-decor strength signals strong potential for clothing and decor designs.
4. Why do shoppers prefer TikTok for product discovery?
Discovery on TikTok is intentional and organic, and the buying loop compresses discovery, evaluation, and purchase into one session. 83% of shoppers discovered a new product and 70% a new brand on TikTok Shop, 41% of Gen Z search social platforms first (ahead of traditional search at 32%), and TikTok drives 23.2% of Gen Z product discovery versus Google's 18.8%.
5. How should POD sellers use creators on TikTok Shop?
Do not treat a creator post as a one-off awareness play. It works best when the creator content is also turned into performance ad creative, so it works on two levels - trust and brand value, plus paid conversion. The most valuable output of a collaboration is often the raw footage you can repurpose into a paid TikTok ad, since authentic creator-filmed content outperforms polished brand creative on the feed.
6. What is the average order value on TikTok Shop?
Based on 2024 data, TikTok Shop's average order value was about 35 USD with 5.3 transactions per customer. For comparison, Etsy reported roughly 121 USD in gross merchandise sales per buyer across 89.6 million active buyers - a different buyer profile, which is part of why the two channels complement rather than cannibalize each other.

Saulius Meilutis is the CEO of Podbase, helping creators and entrepreneurs monetize their ideas with print-on-demand. He shares insights on eCommerce, growth, and building lean online businesses.

.avif)

.avif)


.avif)
.avif)
.avif)
.avif)
.avif)
.avif)

.avif)
.avif)

.avif)


.avif)
.avif)