WooCommerce statistics tell a surprising story. Shopify grabs the headlines, but WooCommerce quietly powers more online stores than any other platform on earth. It supports millions of shops across every country and every type of business - and it's free and open-source, letting sellers customize without limits.
But here's the 2026 nuance most stat roundups miss, and it matters if you're choosing a platform this year: WooCommerce has stopped growing explosively. After climbing fast from 2020 to 2023, live-store counts peaked at about 4.75 million in Q4 2024 and have since settled back to roughly 4.34 million (Store Leads, May 2026) - a mature plateau, not a rocket ship. That's not a weakness; it means WooCommerce is now a stable, replacement-and-optimization market where the winners are the sellers who execute well, not the ones who simply showed up early.
Whether you're an entrepreneur picking a platform or a print-on-demand seller checking where customers shop, these WooCommerce statistics matter - and they matter even more for sellers using Podbase, which connects directly with WooCommerce so you can tap the platform's scale without switching or rebuilding.
WooCommerce by the Numbers: Scale, Reach, and Adoption
WooCommerce usage statistics for 2026 make one thing clear: this platform is everywhere.
- Active Installs: Over 7 million active installs on WordPress.org - a broader count than live storefronts (it includes dev, staging, and multisite). All-time downloads exceed 441 million, with 30,000-50,000 downloads per day.
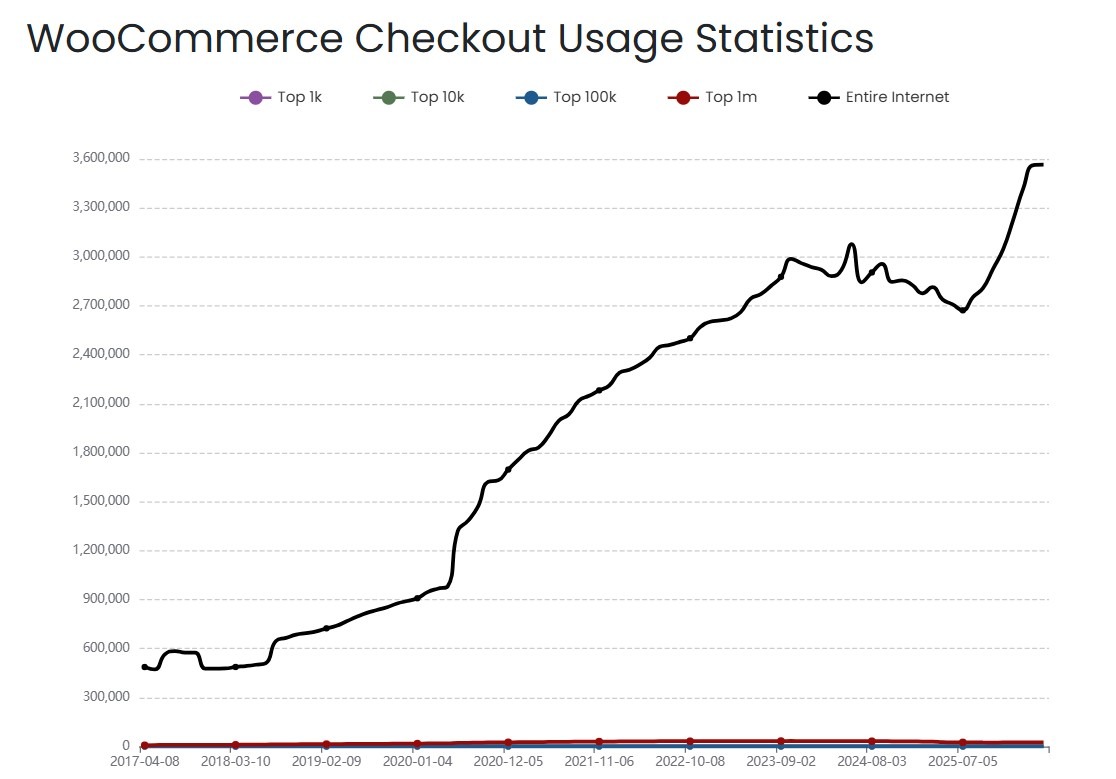
- Live Store Count: Roughly 4.34 million active live WooCommerce stores as of May 2026 (Store Leads), with around 3.5 million confirmed live "Cart Checkout" pages (BuiltWith) - the most reliable measure of real storefronts. Note the trajectory: this is down about 8.6% from the Q4 2024 peak of ~4.75M, signaling a mature market rather than runaway growth.
- Geographic Spread: Operates in over 200 countries. The US leads (~543,000 stores, ~12%), followed by the UK (~187,000, 4.2%), India (~149,000, 3.3%), and Germany (~120,000, 2.7%).
- Global Market Share: Depending on methodology, WooCommerce holds roughly 30-38% of ecommerce sites by store count (StackedReview: ~33.4%) and about 49% of known ecommerce systems (W3Techs, early 2026) - still the most widely used ecommerce platform in the world.
- Plugin Ecosystem: 65+ official "developed by Woo" extensions, 1,300+ official plugins, and thousands of compatible third-party plugins - including Podbase's native WooCommerce integration.
These WooCommerce market-share figures prove open-source can hold its own against closed platforms.
Also Read:
WooCommerce vs. the Competition: How It Stacks Up in 2026
WooCommerce and Shopify are the two biggest names in ecommerce - WooCommerce leads on reach and flexibility, Shopify on polish and revenue concentration.
- Store Count vs. Revenue Concentration: By live-store count, WooCommerce (~4.34M) roughly doubles Shopify (~2.84M). But among the top one million sites by traffic, Shopify leads (28.8% vs WooCommerce's 18.2%). WooCommerce has more stores; Shopify rules the high-traffic, high-revenue ones.
- Gross Merchandise Volume (GMV): WooCommerce stores generated an estimated $30-35 billion in 2025; Shopify processed over $378 billion. More stores, smaller average baskets - exactly the lean-seller profile POD thrives in.
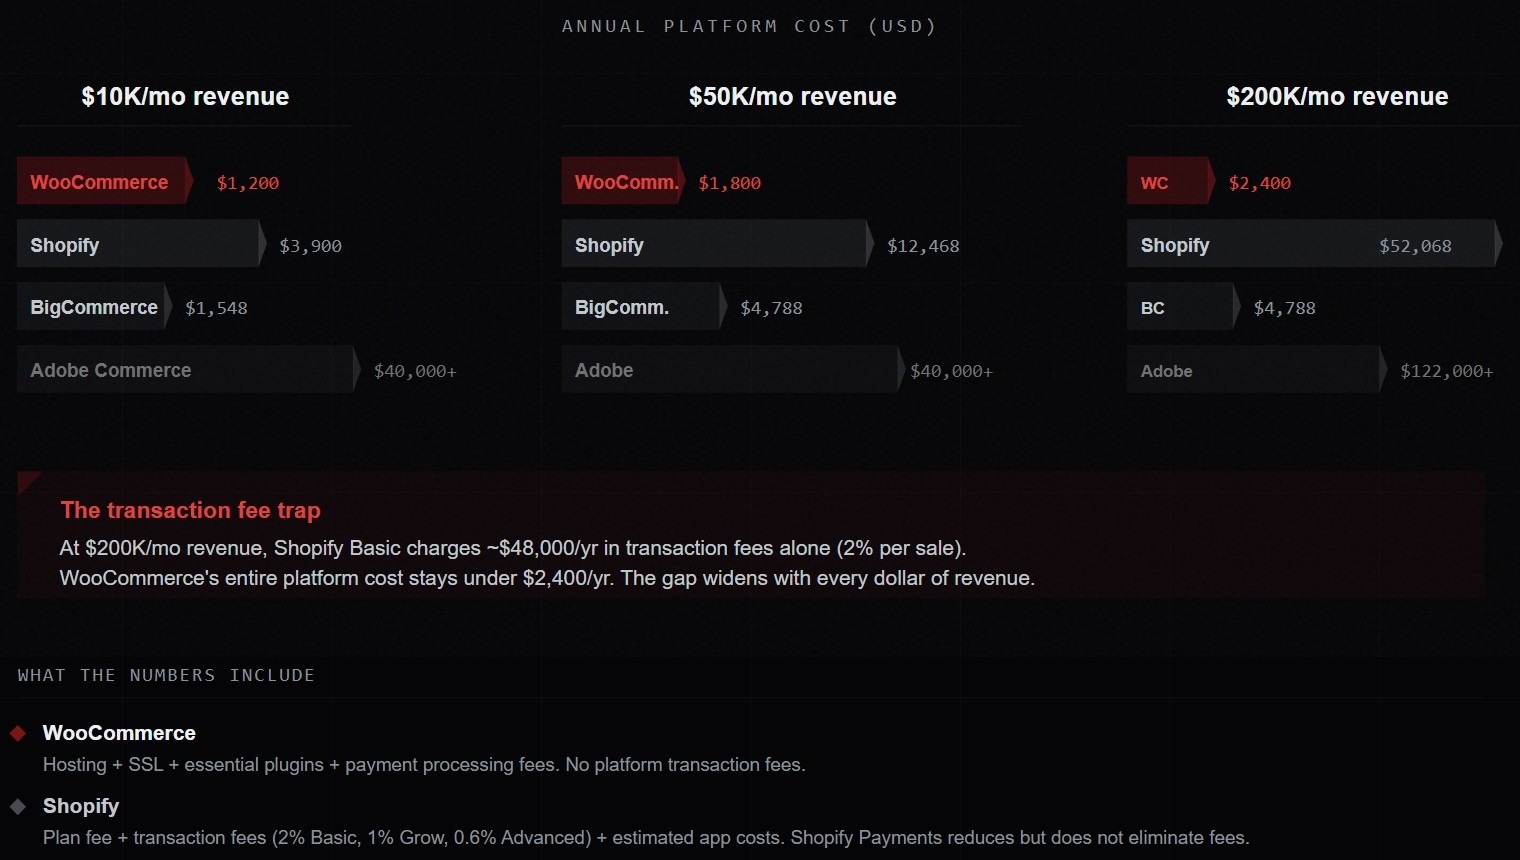
- Cost: The WooCommerce plugin is free with no monthly platform fee; all-in yearly costs (hosting, themes, plugins) range widely from ~$1,800 to $67,000+. Shopify runs $39-$399/month plus transaction costs.
- Conversion & AOV: WooCommerce averages a 2.3% conversion rate (top stores hit 5.5%) and an AOV around $122 - higher than Shopify's reported $92.
Here's where most stat articles stop - and where the Podbase experience adds something they can't. That $122 AOV is a *baseline*, not a ceiling. Our internal data shows a single checkout upsell - a screen protector added to a phone case, for example - converts at 3 to 10%, adding around €10 of profit on a customer you already paid to acquire. As our CEO Saulius puts it: "With a single button on the checkout page, you can get 10 euros more profit, and you spent the same amount to attract that customer." On a $122 baseline, that's how lean sellers turn a benchmark into a margin.
A blunter take worth stating, because beginners burn months here: the WooCommerce-vs-Shopify debate is largely overrated. Both convert. What actually separates sellers who succeed from those who churn isn't the platform - it's speed to launch and the quality of the product and fulfilment behind it. Our pipeline data is clear on this: a seller who places a sample order in the first two days and has five products live within 30 days is already ahead of 80% of POD stores; ten sales puts them in the top 10%. Pick a platform you can launch on this week and move.
Also Read:
Who Uses WooCommerce? Merchant Demographics and Store Profiles
WooCommerce usage statistics in 2026 show a platform built for, and dominated by, independent, focused, lean businesses - the exact profile of a successful POD store.
- Business Size: 81.7% of users are small businesses with 1-10 employees; 93.7% have fewer than 50. WooCommerce is the home of entrepreneurs, creators, and lean ecommerce teams.
- Catalog Size: 31.8% of stores sell just 1-9 products; 12.4% sell 10-24. Tight, focused catalogs - precisely how POD operates.
- Top Categories: Home & Garden leads (11% of stores), then Apparel (8.9%), Business & Industrial (7.6%), Food & Drink (7.3%). 70% of WooCommerce sales are physical products, 18% digital, 12% subscriptions.
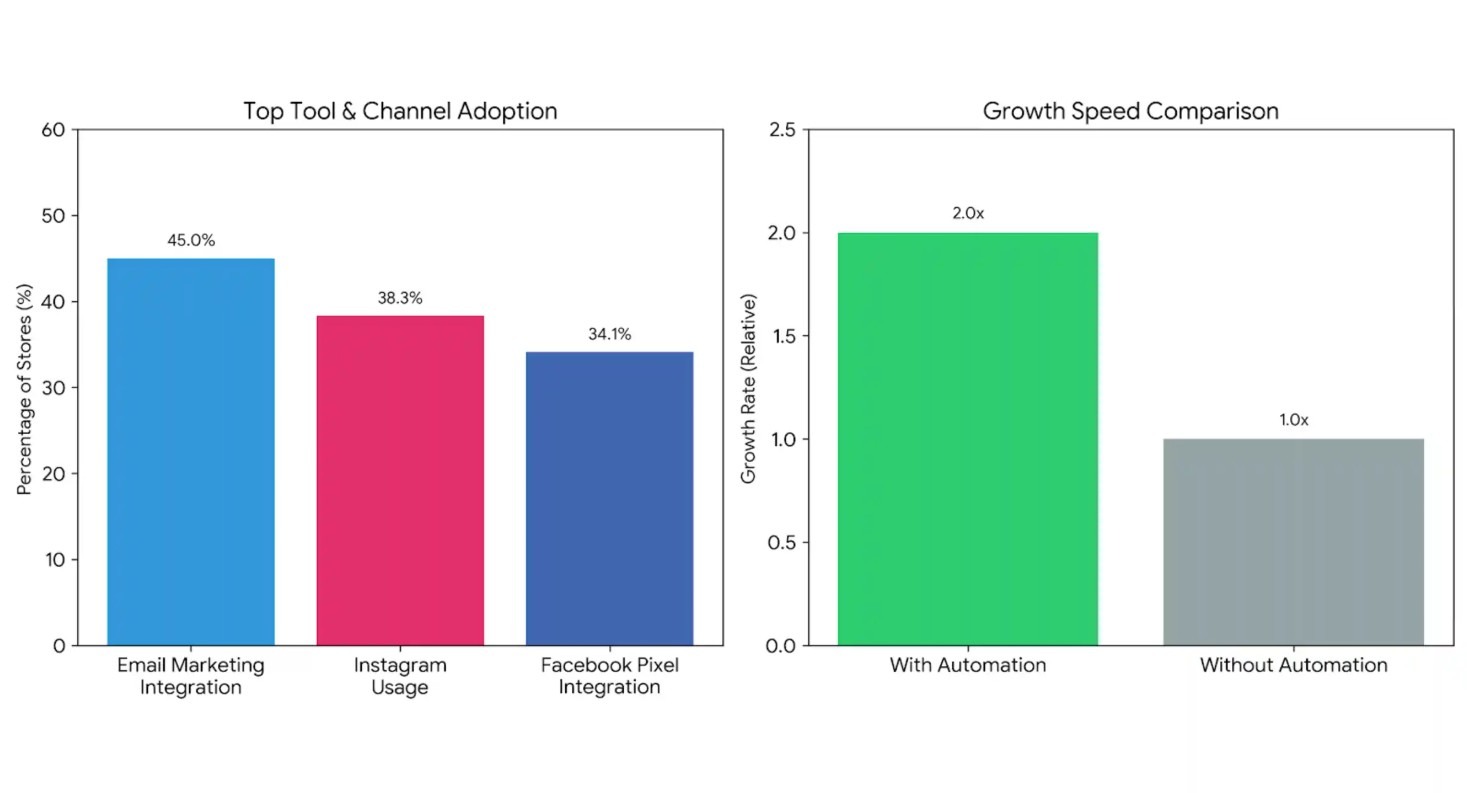
- Social Selling: 38.7% sell on Instagram, 35.5% Facebook, 13.1% YouTube; ~45% use email marketing, and stores with marketing automation grow about twice as fast.
- Mobile Behavior: ~73% of traffic and ~62% of orders are mobile, but mobile cart abandonment runs ~80%; optimized mobile checkout can lift conversion ~30%. This tracks the wider market - mobile drives 60%+ of all web traffic and the average person checks their phone ~144 times a day - so a mobile-first store isn't optional.
- Revenue Breakdown: Over 17,500 stores clear $100k+/year, 3,700+ exceed $1M, and over 858,000 pass $5k - a massive pool of lean, viable sellers.
Also Read:
WooCommerce and Print-on-Demand: What the Data Means for POD Sellers
These WooCommerce statistics map almost perfectly onto how a print-on-demand business actually runs.
- Cost Advantage: $0 licensing keeps entry barriers low - the same lean-COGS logic that makes POD work. (POD itself adds zero inventory risk on top.)
- Catalog Structure: The ~32% of stores selling 1-9 products aren't under-built - that focus *is* the POD model: a tight lineup of phone cases, laptop sleeves, wall art, or tech accessories, with no stock to manage.
- Performance Benchmarks: The 2.3% conversion / $122 AOV baseline is your scoreboard. Beat it with upsells and tight targeting - and remember that, in our data, specificity beats coverage: a store that owns one niche outperforms one that sells a bit of everything.
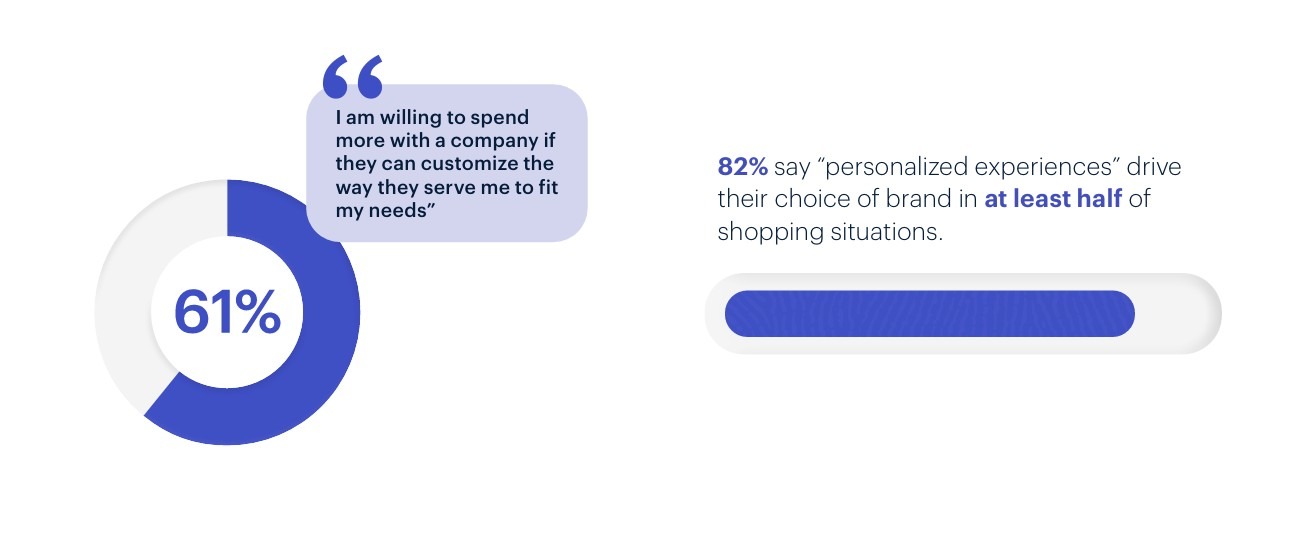
- Personalization Converts: A 2023 Medallia report found 82% of consumers prefer brands offering custom options - and separate industry data shows 1 in 5 buyers pays at least 20% more for a personalized product. This is the heart of POD. As Saulius describes it, a custom phone case becomes "your personal billboard" - and at a ~€10 base cost selling for €35-60, it's one of the highest-margin personal items you can offer. A €45 custom case isn't competing with a generic accessory; it's competing with jewelry, and winning on personalization.
- Industry Growth Context: The global print-on-demand market was valued at $12.96 billion in 2025 and is projected to reach $118.85 billion by 2035 (24.81% CAGR), with home décor the fastest-growing category at ~28% CAGR.
- Category Alignment: WooCommerce's largest category, Home & Garden (11%), overlaps POD's fastest-growing niche - custom wall art and personalized décor - making WooCommerce a natural fit for POD expansion.
- Integration Pathway: Podbase integrates natively with WooCommerce. Connect your store, add tech accessories and laptop cases, and start fulfilling - printed, packed, and dispatched within 24-48 hours, shipped from the EU (and across the US and Oceania), with no fulfillment fees and 30-60% margins on tech accessories.
WooCommerce in 2026 and Beyond: Key Trends Shaping the Platform
WooCommerce keeps getting faster and smarter - and these updates matter for anyone building a store.
- High-Performance Order Storage (HPOS): Delivers up to 5× faster order creation and 1.5× faster checkout - keeping stores responsive during high-traffic seasonal windows, which is exactly when POD sellers can't afford a slow checkout.
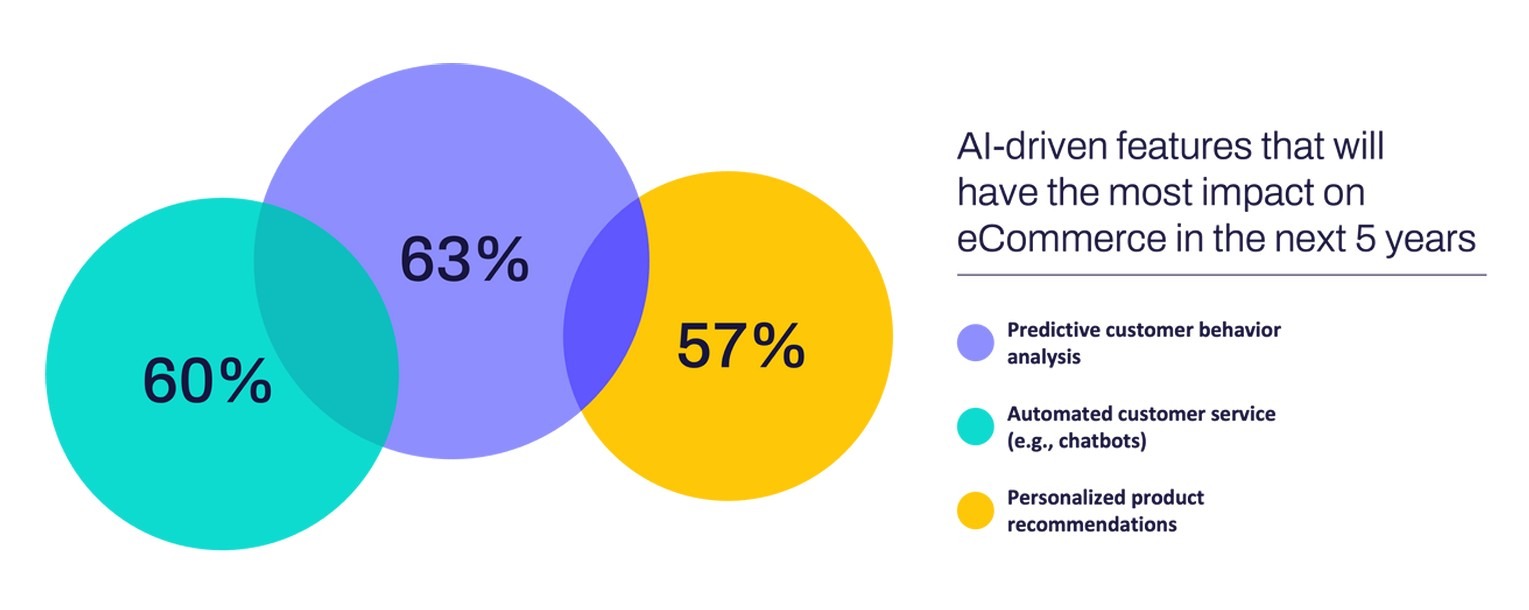
- AI-Powered Features: Product recommendations, chatbots, and predictive buying are now common - 97% of ecommerce decision-makers say AI is reshaping the industry. This mirrors what we see internally: AI has compressed the work of launching and running a POD store. Our CEO notes that store owners now "build their own scripts and integrations with AI without any coding experience," and generate multi-angle product mockups from a single image instead of ordering samples and running photo shoots. The practical result - average onboarding time for a new POD project has dropped from about three months to under one.
- Headless Commerce: Larger stores increasingly separate front end from backend for speed and flexibility - which also makes connecting tools like Podbase cleaner.
- Market Outlook - Maturity, Not Hypergrowth: WooCommerce remains the most-used ecommerce system (~49% of known systems, early 2026), riding WordPress's ~42% share of all websites. But the honest read of the store-count data is a plateau: down ~8.6% from the 2024 peak. For sellers, that's good news, not bad - a mature platform means stability, a deep plugin ecosystem, and less risk that your foundation shifts under you. The growth opportunity has moved from "get on WooCommerce early" to "execute better than the millions already on it."
The takeaway: WooCommerce is a stable, low-cost, fully owned base - and the sellers who win on it in 2026 are the ones who launch fast, optimize relentlessly, and add high-margin products. It pairs perfectly with Podbase. No platform switch, no rebuild - just connect your store, add products, and start selling.
Also Read:
FAQ
1. How many stores use WooCommerce in 2026?
There are roughly 4.34 million active live WooCommerce stores as of May 2026 (Store Leads), with about 3.5 million confirmed live checkout pages (BuiltWith). The plugin has over 7 million active installs and 441 million all-time downloads. Notably, live-store counts are down about 8.6% from the Q4 2024 peak of 4.75 million, signaling a mature plateau rather than runaway growth.
2. Is WooCommerce bigger than Shopify?
By live-store count, yes - WooCommerce (~4.34M) roughly doubles Shopify (~2.84M). But Shopify dominates high-traffic, high-revenue stores: among the top one million sites by traffic it leads 28.8% to WooCommerce's 18.2%, and it processed over $378 billion in GMV versus WooCommerce's estimated $30-35 billion. WooCommerce has more stores; Shopify rules the largest ones.
3. What is the average order value on WooCommerce?
WooCommerce stores average an order value of about $122, higher than Shopify's reported $92, with a 2.3% average conversion rate (top stores reach 5.5%). That $122 is a baseline, not a ceiling: a single checkout upsell, like a screen protector on a phone case, converts at 3-10% in Podbase data and adds about €10 of profit per order.
4. How much does WooCommerce cost?
The WooCommerce plugin is free and open-source with no monthly platform fee. Real all-in annual costs - hosting, themes, and plugins - range widely from about $1,800 to $67,000+ depending on store complexity. By comparison, Shopify runs $39-$399/month plus transaction costs. The low entry barrier suits lean sellers and print-on-demand businesses.
5. Is WooCommerce good for print-on-demand?
Yes. Its zero licensing cost, focus on lean small businesses (81.7% have 1-10 employees), and tight catalogs (about 32% sell 1-9 products) map directly onto how POD operates. Podbase integrates natively with WooCommerce, so you can add tech accessories and wall art and fulfill them within 24-48 hours, shipped from the EU, US, and Oceania with no fulfillment fees.
6. Should I choose WooCommerce or Shopify for a new store?
The debate is overrated - both convert well. WooCommerce offers full ownership, no platform fee, and unlimited customization; Shopify offers polish and a managed experience. What actually separates sellers who succeed is speed to launch and the quality of the product and fulfillment behind it. Podbase data shows a seller who publishes five products within 30 days is ahead of 80% of POD stores, so pick the platform you can launch on this week.

Saulius Meilutis is the CEO of Podbase, helping creators and entrepreneurs monetize their ideas with print-on-demand. He shares insights on eCommerce, growth, and building lean online businesses.

.avif)

.avif)


.avif)
.avif)
.avif)
.avif)
.avif)
.avif)


.avif)

.avif)

.avif)


.avif)
.avif)

.avif)